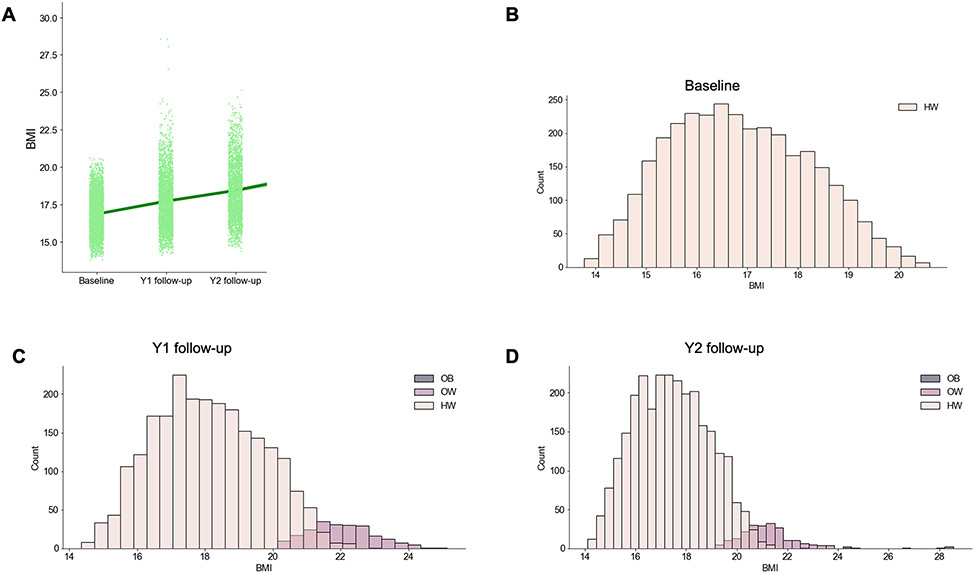
Figure 1.
Body mass index (BMI) and weight status classification (according to the CDC age-sex-weight-height growth charts) distributions. HW = healthy weight; OW = overweight; OB = obese. B-D represent the number of youth who transitioned from a healthy weight to having overweight or obesity by the year 1 (Y1) and year 2 (Y2) follow-up visits.

