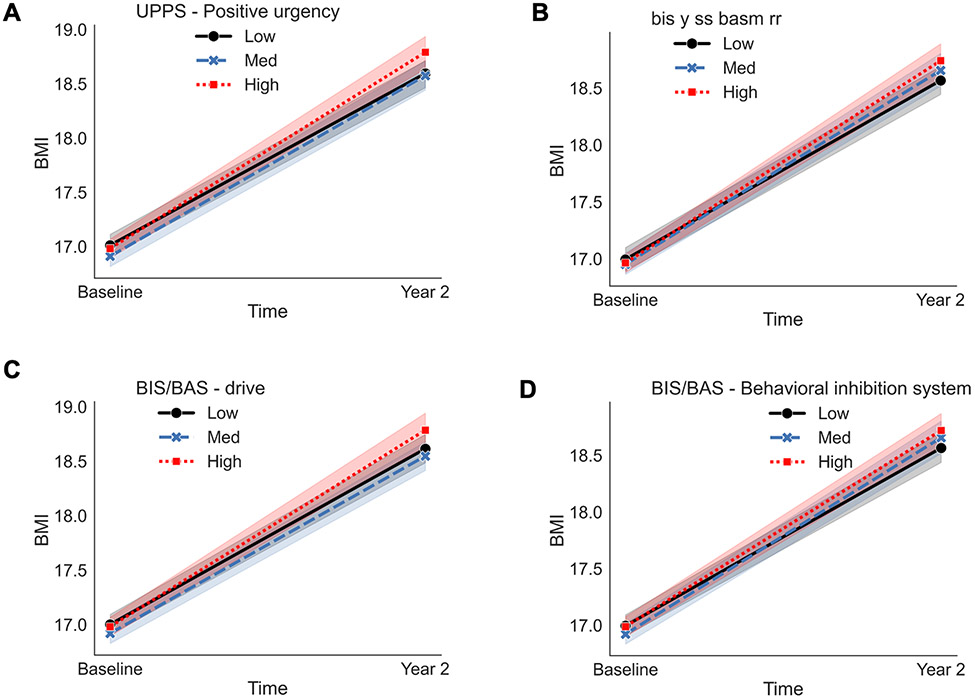
Figure 2.
Observed data are plotted on the x- and y-axis for each assessment measurement at levels of −1 standard deviation (SD; low, solid black line with circle end points), the mean (e.g., med, blue, large dashed line with x end points), and +1 SD (e.g., high, red mini dashed line with square end points). BMI = body mass index. UPPS = Urgency, Premeditation (lack of) Perseverance (lack of), Sensation Seeking, Positive Urgency, Impulsive Behavior Scale. BIS/BAS = Behavioral Inhibition System/ Behavioral Approach System. Baseline = ages 9/10-years-old; Year 2= ages 11/12-years-old. The mixed model was adjusted for sex, puberty, and caregiver education. Fixed effects were effects coded and random effects were modeled for ABCD Study® site and subject. An interaction term was included for EF*Time (e.g., baseline [ages, 9/10-years-old], Year 2 [ages 11/12-years-old]).

