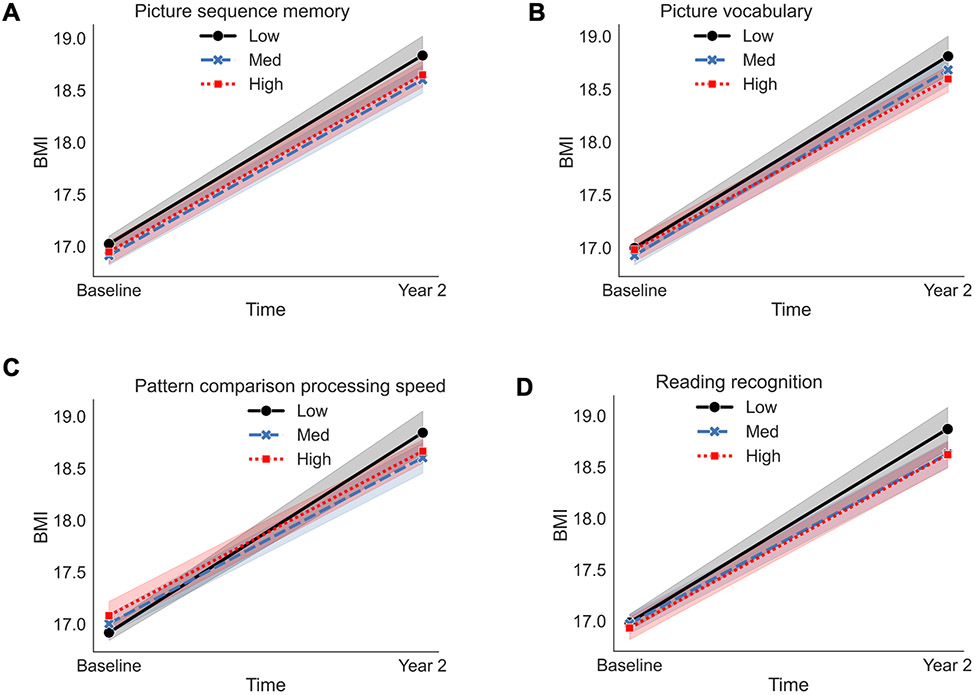
Figure 3.
Visualizations of the two-way interaction effects for the NIH Toolbox results for the Dual Processes Model of Overeating (i.e., underlying differences in EF are related to changes in weight status [dependent variable]). A-D represent observed data are plotted on the x- and y-axis for each assessment measurement at levels of −1 standard deviation (SD; low, solid black line with circle end points), the mean (e.g., med, blue, large dashed line with x end points), and +1 SD (e.g., high, red mini dashed line with square end points). The mixed model was adjusted for sex, puberty, and caregiver education. Fixed effects were effects coded and random effects were modeled for ABCD Study® site and subject. An interaction term was included for EF*Time (e.g., baseline [ages, 9/10-years-old], Year 2 [ages 11/12-years-old]). Low corresponds to lower performance. BMI = body mass index.

