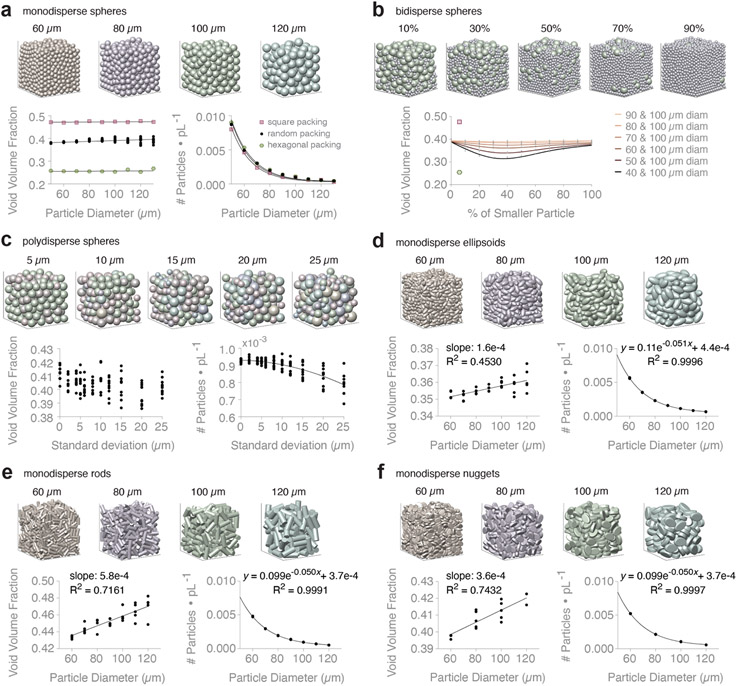
Figure 1. Void volume fraction (VVF) of simulated packed particles in 600 x 600 x 600 μm3 container.
a, Monodisperse spheres in square, hexagonal, and random packing configuration. Showing VVF and # of particles per picoliter (pL) for increasing particle diameter. N = 10 domains. b, Binary mixtures of spheres. Domain images are showing 40 + 100 μm diameter spheres at increasing percentage of the 40 μm diameter population (by volume). Plotting VVF of different binary mixtures (see key). For each pair of particle species, we report VVF at varying percent mixtures by volume. N = 10 domains. VVF of square packing (pink square) and hexagonal packing (green hexagon) shown for reference. c, Polydisperse spheres that follow a normal distribution with mean = 100 μm. Domain images are showing increasing polydispersity due to increasing standard deviation (σ). Showing VVF and # of particles per pL for increasing σ. N = 10 domains. d, Monodisperse ellipsoids. Showing VVF and # of particles per pL for increasing particle diameter. N = 5 domains. e, Monodisperse rods. Showing VVF and # of particles per pL for increasing particle diameter. N = 5 domains. f, Monodisperse nuggets. Showing VVF and # of particles per pL for increasing particle diameter. N = 5 domains. See Supplementary Figure 6 for simple linear regression equations of VVF data.

