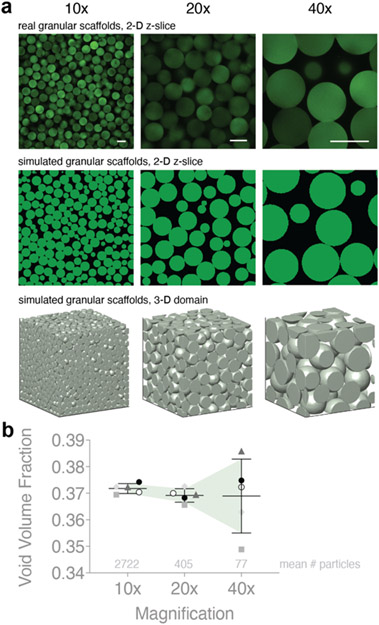
Figure 2. Simulating microscope magnification.
a, Sample z-slice images from real granular scaffolds are used to calibrate our simulated scaffolds at varying magnifications. b, VVF of simulated domains is compared at different magnifications. Higher magnification yields less precise VVF. Average number of particles in 3-D domain at each magnification are shown above the x-axis. N = 5 domains for each category. Scale bars = 100 μm. Errors bars denote standard deviation.

