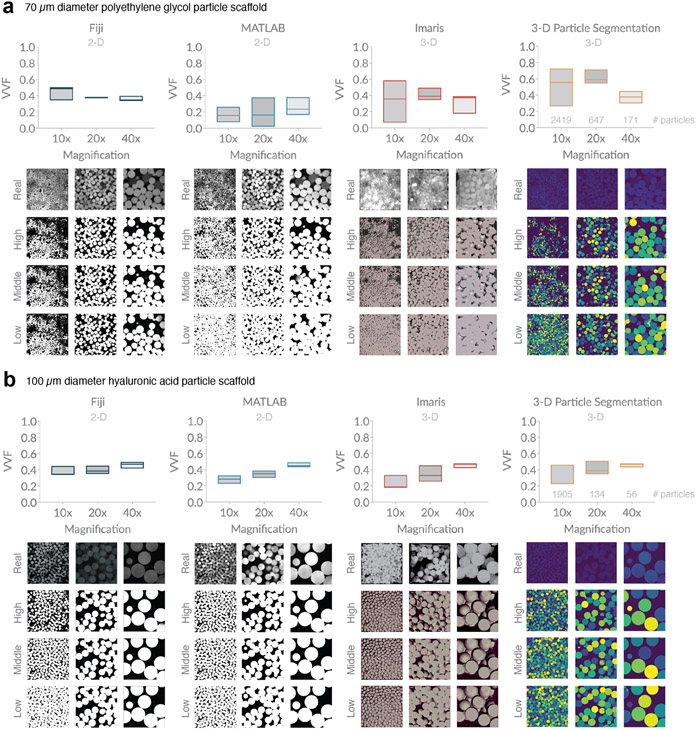
Figure 4. Variation in void volume fraction (VVF) of granular scaffolds across different software, magnification, and user-bias.
a, Scaffolds comprising 70 μm diameter polyethylene glycol (PEG) particles were analyzed for VVF using Fiji, a custom MATLAB code, Imaris software, and a custom particle segmentation code. For each magnification, we report box plots indicating a low (bottom line), middle (middle line), and high (top line) VVF that reflect variation in user-inputted parameters or settings. Below each software plot, we show sample z-slice microscope images from the sample, as well as low, middle, and high binarization outputs. Scaffolds were imaged with the following z-gap and number of z-slices: (10x) 4.075 μm, 36 slices, (20x) 1.20 μm, 118 slices, (40x) 1.00 μm, 142 slices. b, Scaffolds comprising 100 μm diameter hyaluronic acid (HA) particles were analyzed in the same manner as (a). Z-gap and number of z-slices were as follows: (10x) 3.875 μm, 40 slices, (20x) 1.20 μm, 101 slices, (40x) 1.10 μm, 192 slices. The number of particles at each magnification are approximated with the 3-D Particle Segmentation code and reported above the x-axis in the corresponding plots for (a) and (b).

