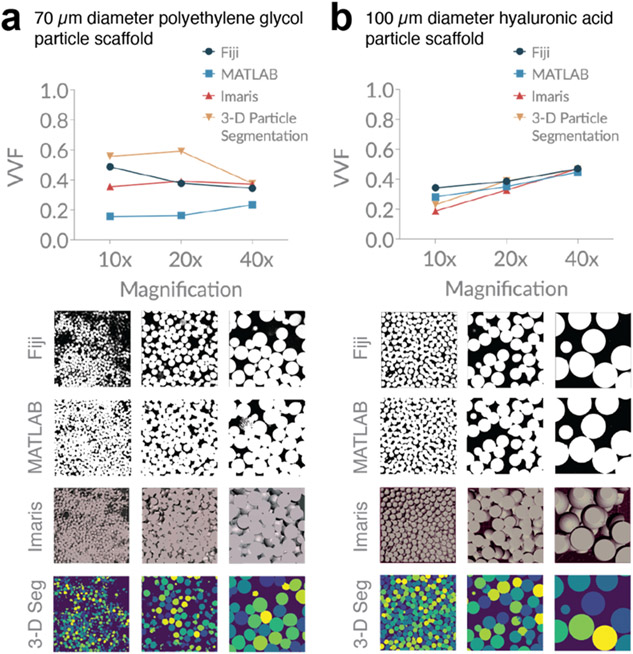
Figure 5. Microscope magnification and analysis software influences VVF measurements.
a, Our PEG scaffolds highlight the variation in VVF that can be seen across different software when ‘middle’ range parameters and settings are used. b, Our HA scaffolds highlight the variation in VVF that can be seen across different microscope magnifications. Sample z-slice images are shown below for comparison.

