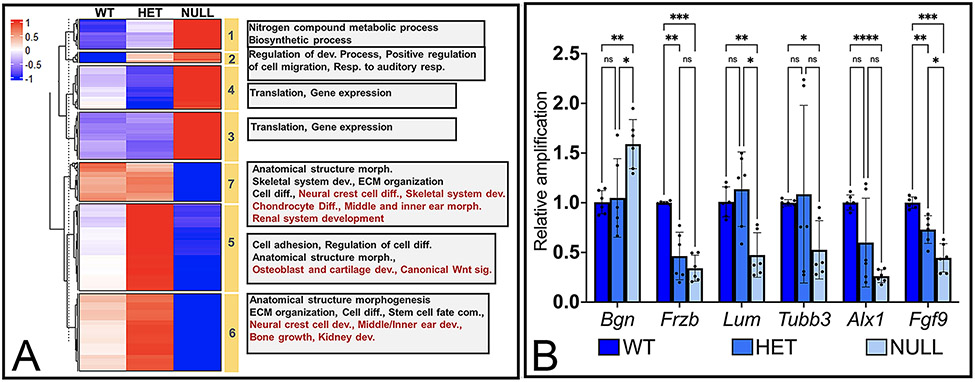
Figure 2: Differential expression analysis of genes in WT, Six1-het and Six1-null mandibular arches.
(A) Heatmap with K-means cluster analysis of averaged, z-score scaled, FPKM values for gene expression in each genotype. Yellow bars mark cluster number. Grey boxes list gene ontology terms represented in each cluster. (B) Quantitative-PCR (qPCR) validation of expression pattern of select genes from cluster 1 (Bgn), 5 (Frzb), 6 (Lum, Tubb3), 7 (Alx1, Fgf9) in WT, Six1-het (HET) and Six1-null (NULL) arches. *P<0.05, ** P< 0.01, *** P<0.001, **** P<0.0001, ns: not significant. n=3. Actb was used as housekeeping gene.

