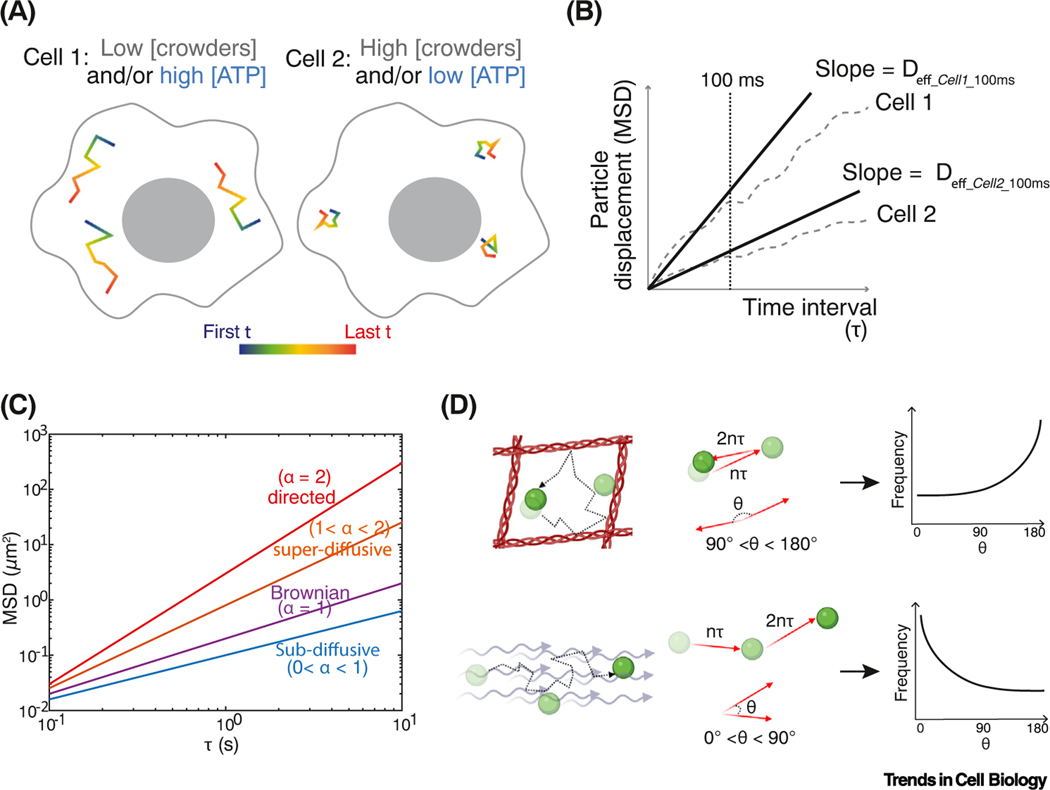
Figure 3. Particle-tracking microrheology and one-point rheology analysis.
(A) Hypothetical trajectories of tracer particles in different intracellular environments. Motion is decreased by high crowding, and increased by ATP-driven agitation. (B) Ensemble and time-averaged mean-squared displacement (MSD) plots of these hypothetical cells. Effective diffusion coefficients (Deff) are calculated from the slope of MSD as a function of time interval (τ). The cell is crowded, heterogeneous, and structured, giving different effective diffusion coefficients at different time scales. We therefore define an effective diffusion coefficient at a specific time scale, for example, effective diffusivity at 100 ms = Deff_100ms. Deff_100ms is higher for particles in cell 1 than in cell 2. Note: the choice of time scales (broken line) that can be investigated is dependent on the distribution of trajectory lengths that can be experimentally obtained. If the time scale chosen is much longer than the median track length, analysis will be biased to slow-moving particles, which can be misleading. (C) MSD is calculated at each time lag τ from an ensemble of particle trajectories after both time and ensemble averaging. Here, MSD is plotted on a log–log scale where the slope (exponent α) indicates different types of motion. (D) Next step angle bias of particles moving in a confined local region (top) or moving persistently in an active flow (bottom). Next step angle frequency distributions are plotted to the right.

