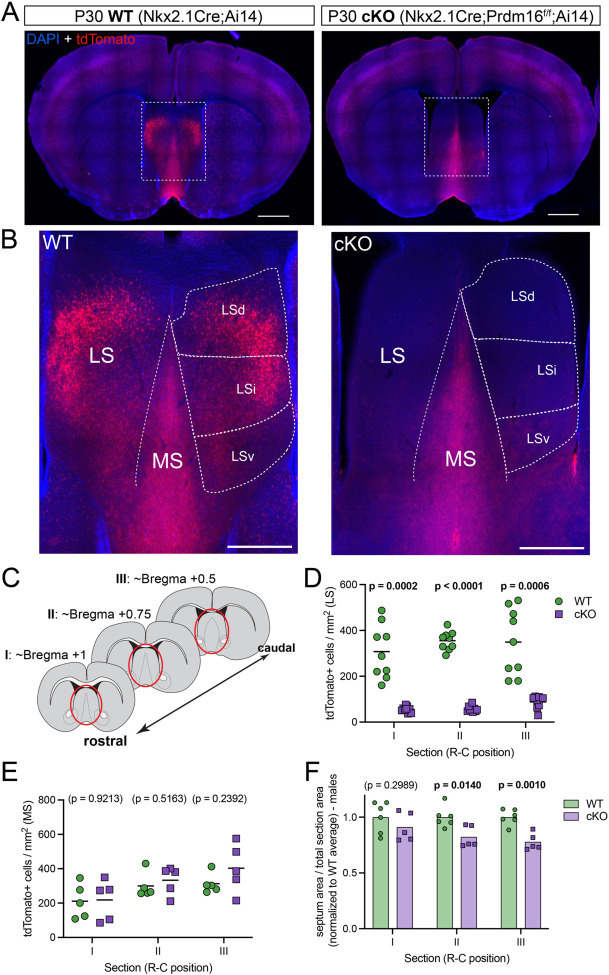
Figure 1: A genetic model to ablate Nkx2.1-lineage neurons in the lateral septum.
A) Coronal sections through the forebrain of postnatal day 30 (P30) control (labeled as ‘WT’; Nkx2.1-Cre;Ai14, left) and mutant (labeled as ‘cKO’; Nkx2.1-Cre;Prdm16flox/flox;Ai14, right) mice, where cells derived from Nkx2.1-expressing progenitors are labeled by the fluorescent reporter tdTomato (red). Nuclei are counterstained with DAPI (blue). Scale bars, 1 mm. B) Closeup of the septum of WT (left) and cKO (right) samples, as highlighted by white dashed line boxes in A. The main anatomical divisions of the mature septum are indicated by white dashed lines: medial septum (MS), lateral septum (LS), and dorsal (LSd), intermediate (LSi) and ventral (LSv) nuclei within the LS. Scale bar, 500 μm. C) Cartoon representing forebrain coronal sections at the three rostrocaudal positions used in subsequent analyses, and labeled as sections ‘I’, ‘II’ and ‘III’ throughout the article. The septal area is highlighted by red ellipses. D) Quantification of the density of cells positive for tdTomato per mm2 in the lateral septum of WT (green circles, n = 9) and cKO (purple squares, n = 9) mice. E) Quantification of the density of cells positive for tdTomato per mm2 in the medial septum of WT (green circles, n = 5) and cKO (purple squares, n = 5) mice. F) Quantification of the area of the septum relative to the total area of its corresponding coronal brain section in WT (green circles, n = 6) and cKO (purple squares, n = 5) male mice. Measurements are normalized to the corresponding WT average. Unpaired t-tests with Welch’s correction were performed; the p-values are shown above the corresponding compared sets of data: bold typeface indicates statistically significant (p<0.05) differences.

