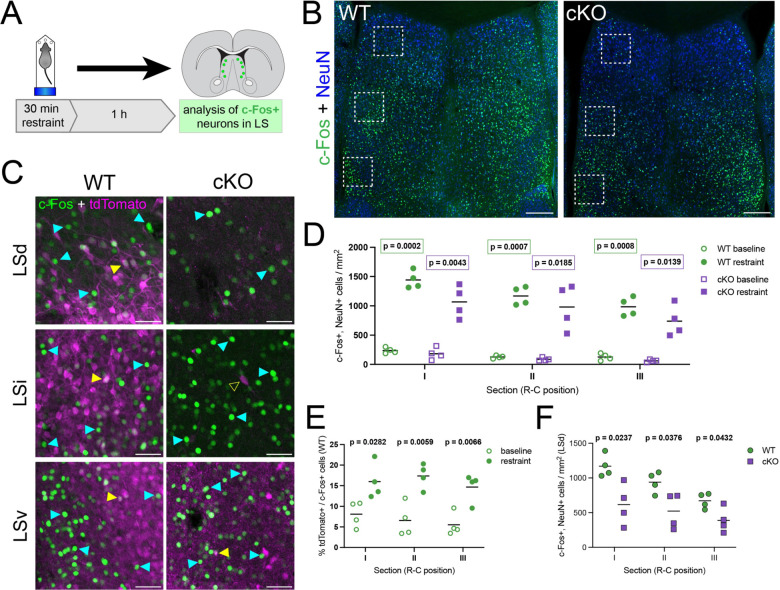
Figure 4: Nkx2.1-lineage neurons in the LSd are activated by an acute stressful stimulus.
A) Experimental design: mice were subjected to 30 minutes of forced restraint and sacrificed 1 hour later; neurons firing in response to the anxiogenic stimulus were identified by immunofluorescence staining for c-Fos. Scale bars, 250 μm. B) Examples of coronal sections of the septum of WT (left) and cKO (right) mice after the forced restraint experiment, immunostained for c-Fos (green) and NeuN (blue). C) Closeup view of the white dashed line boxes in B, showing c-Fos (green) and tdTomato (magenta), in the different subnuclei within the LS of WT (left) and cKO (right) mice. Yellow arrowheads indicate examples of cells positive for both c-Fos and tdTomato; cyan arrowheads highlight c-Fos+, tdTomato– cells, and the empty yellow arrowhead shows an example of a c-Fos–, tdTomato+ cell. Scale bars, 50 μm. D) Comparison of the density of c-Fos+ neurons in the LS of untreated controls (‘baseline’, empty symbols; n = 4 WT, green circles; n = 4 cKO, purple squares) and animals subjected to forced restraint (‘restraint’, full symbols; n = 4 WT, green circles; n = 4 cKO, purple squares). E) Proportion of tdTomato+ neurons within the c-Fos+ population in the LS of WT mice, comparing untreated controls (‘baseline’, empty circles, n = 4) and animals subjected to forced restraint (‘restraint’, full circles, n = 4). F) Comparison of the density of c-Fos+ neurons in the LSd of WT (green circles, n = 4) and cKO (purple squares, n = 4) animals subjected to forced restraint. Unpaired t-tests with Welch’s correction were performed; the p-values are shown above the corresponding compared sets of data: bold typeface indicates statistically significant (p<0.05) differences.

