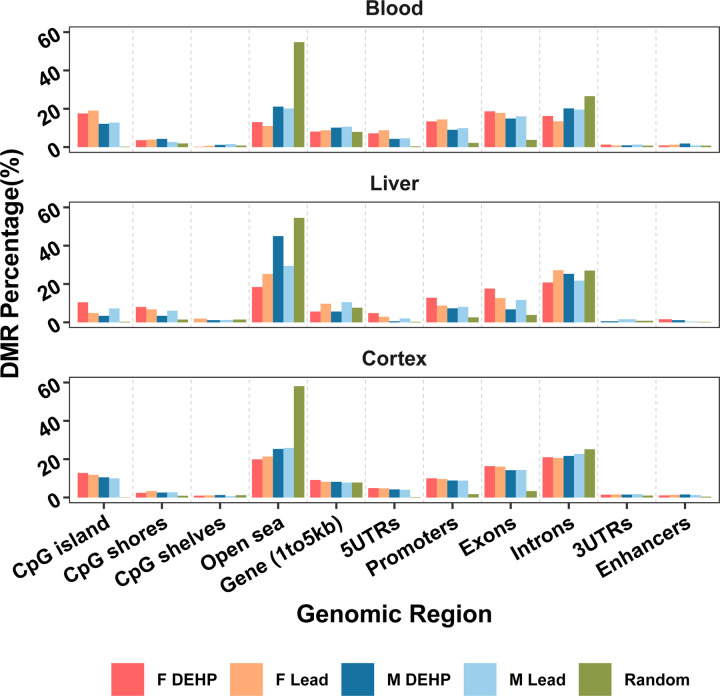
Figure 3: Genomic region of detected Differentially Methylated Regions.
Differentially Methylated Regions (DMRs) were mapped to the mouse reference genome (mm10) and their genomic region annotated as percentage of total DMRs (comparing control and exposed samples) for that sex and exposure within each tissue. This distribution was compared to what would be expected in a random distribution.

