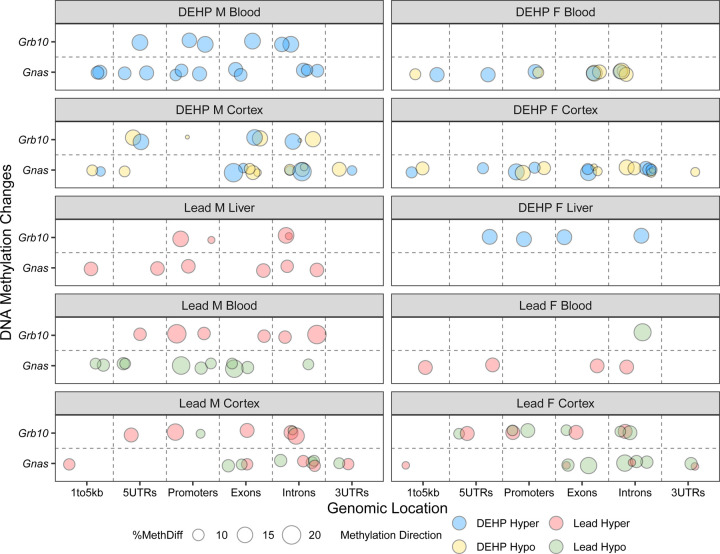
Figure 6: Genomic location and direction of Pb and DEHP-associated Differentially Methylated Regions in the Gnas and Grb10 loci.
Differentially Methylated Regions (DMRs) detected in the Gnas and Grb10 loci were classified as to their genomic location within each gene. Percent change in methylation is denoted by size and direction of methylation change by color (blue = hypermethylated DMRs among DEHP samples, yellow = hypomethylation among DEHP samples, red = hypermethylation among Pb samples, green = among hypomethylation among Pb samples).

