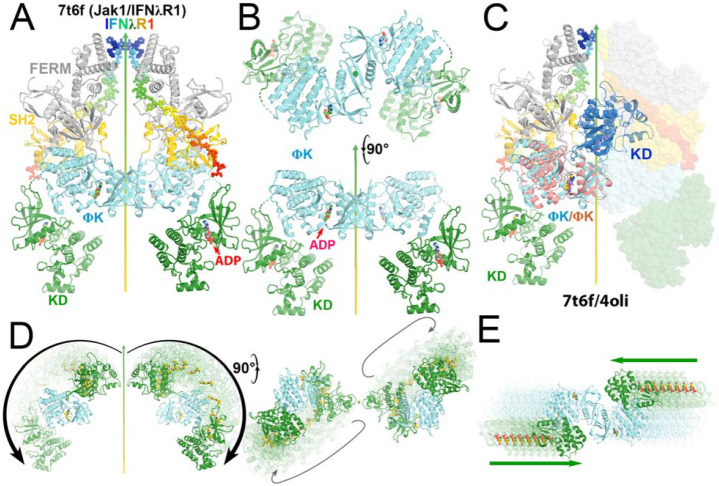
Figure 7.
Comparison of the autoinhibited and the active state for downstream phosphorylation of uSTAT substrates of JAK1 and TYK2. (A) The full-length (JAK1/IFNλR1)2 complex colored by domain. The IFNλR1 receptor are shown in rainbow balls-and-sticks model. (B) Two orthogonal views of JH2-JH1 domain in the active state. (C) Alignment of one autoinhibited TYK2 JH2 (salmon)-JH1 (blue) domains onto the JAK1 complex with one subunit in ribbons and the other in surface model. (D) Two orthogonal views of proposed domain rotation morphing intermediate stages of the hypothetically modeled transition taken from our video. (E) Proposed domain/subunit translation taken from video. See Video 3 for animation.

