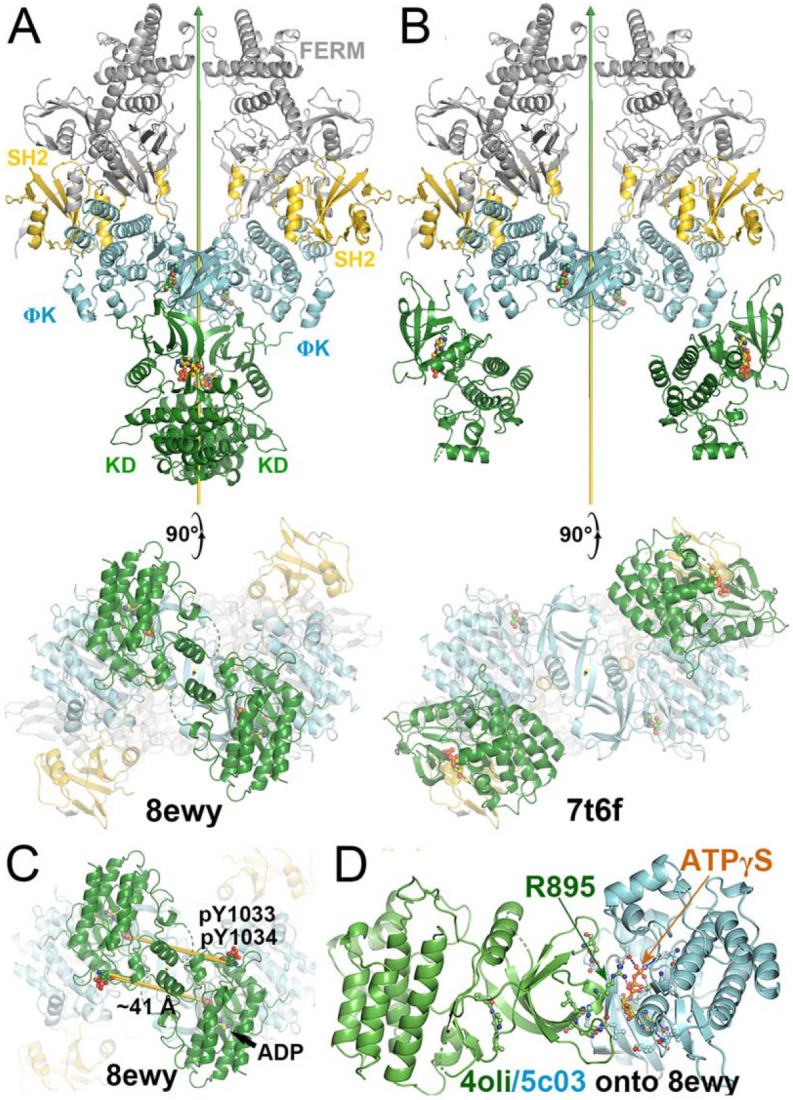
Figure 8.

Comparison of two active states of the (JAK1/IFNλR1)2 complexes and conformational conversion between them. (A) Two orthogonal views of the active state for trans phosphorylation colored by domains. (B) Two orthogonal views of the active state for downstream uSTAT phosphorylation. (C) Distances of trans pY sites to the catalytic site of their partner, indicating additional conformational changes of substrate loop is required for pYpY sites to be phosphorylated. (D) A closeup of the JH2-JH1 interface for modeled TYK2 protein including an ATPγS bound in the TYK2 JH2. See Video 4 for animation.
