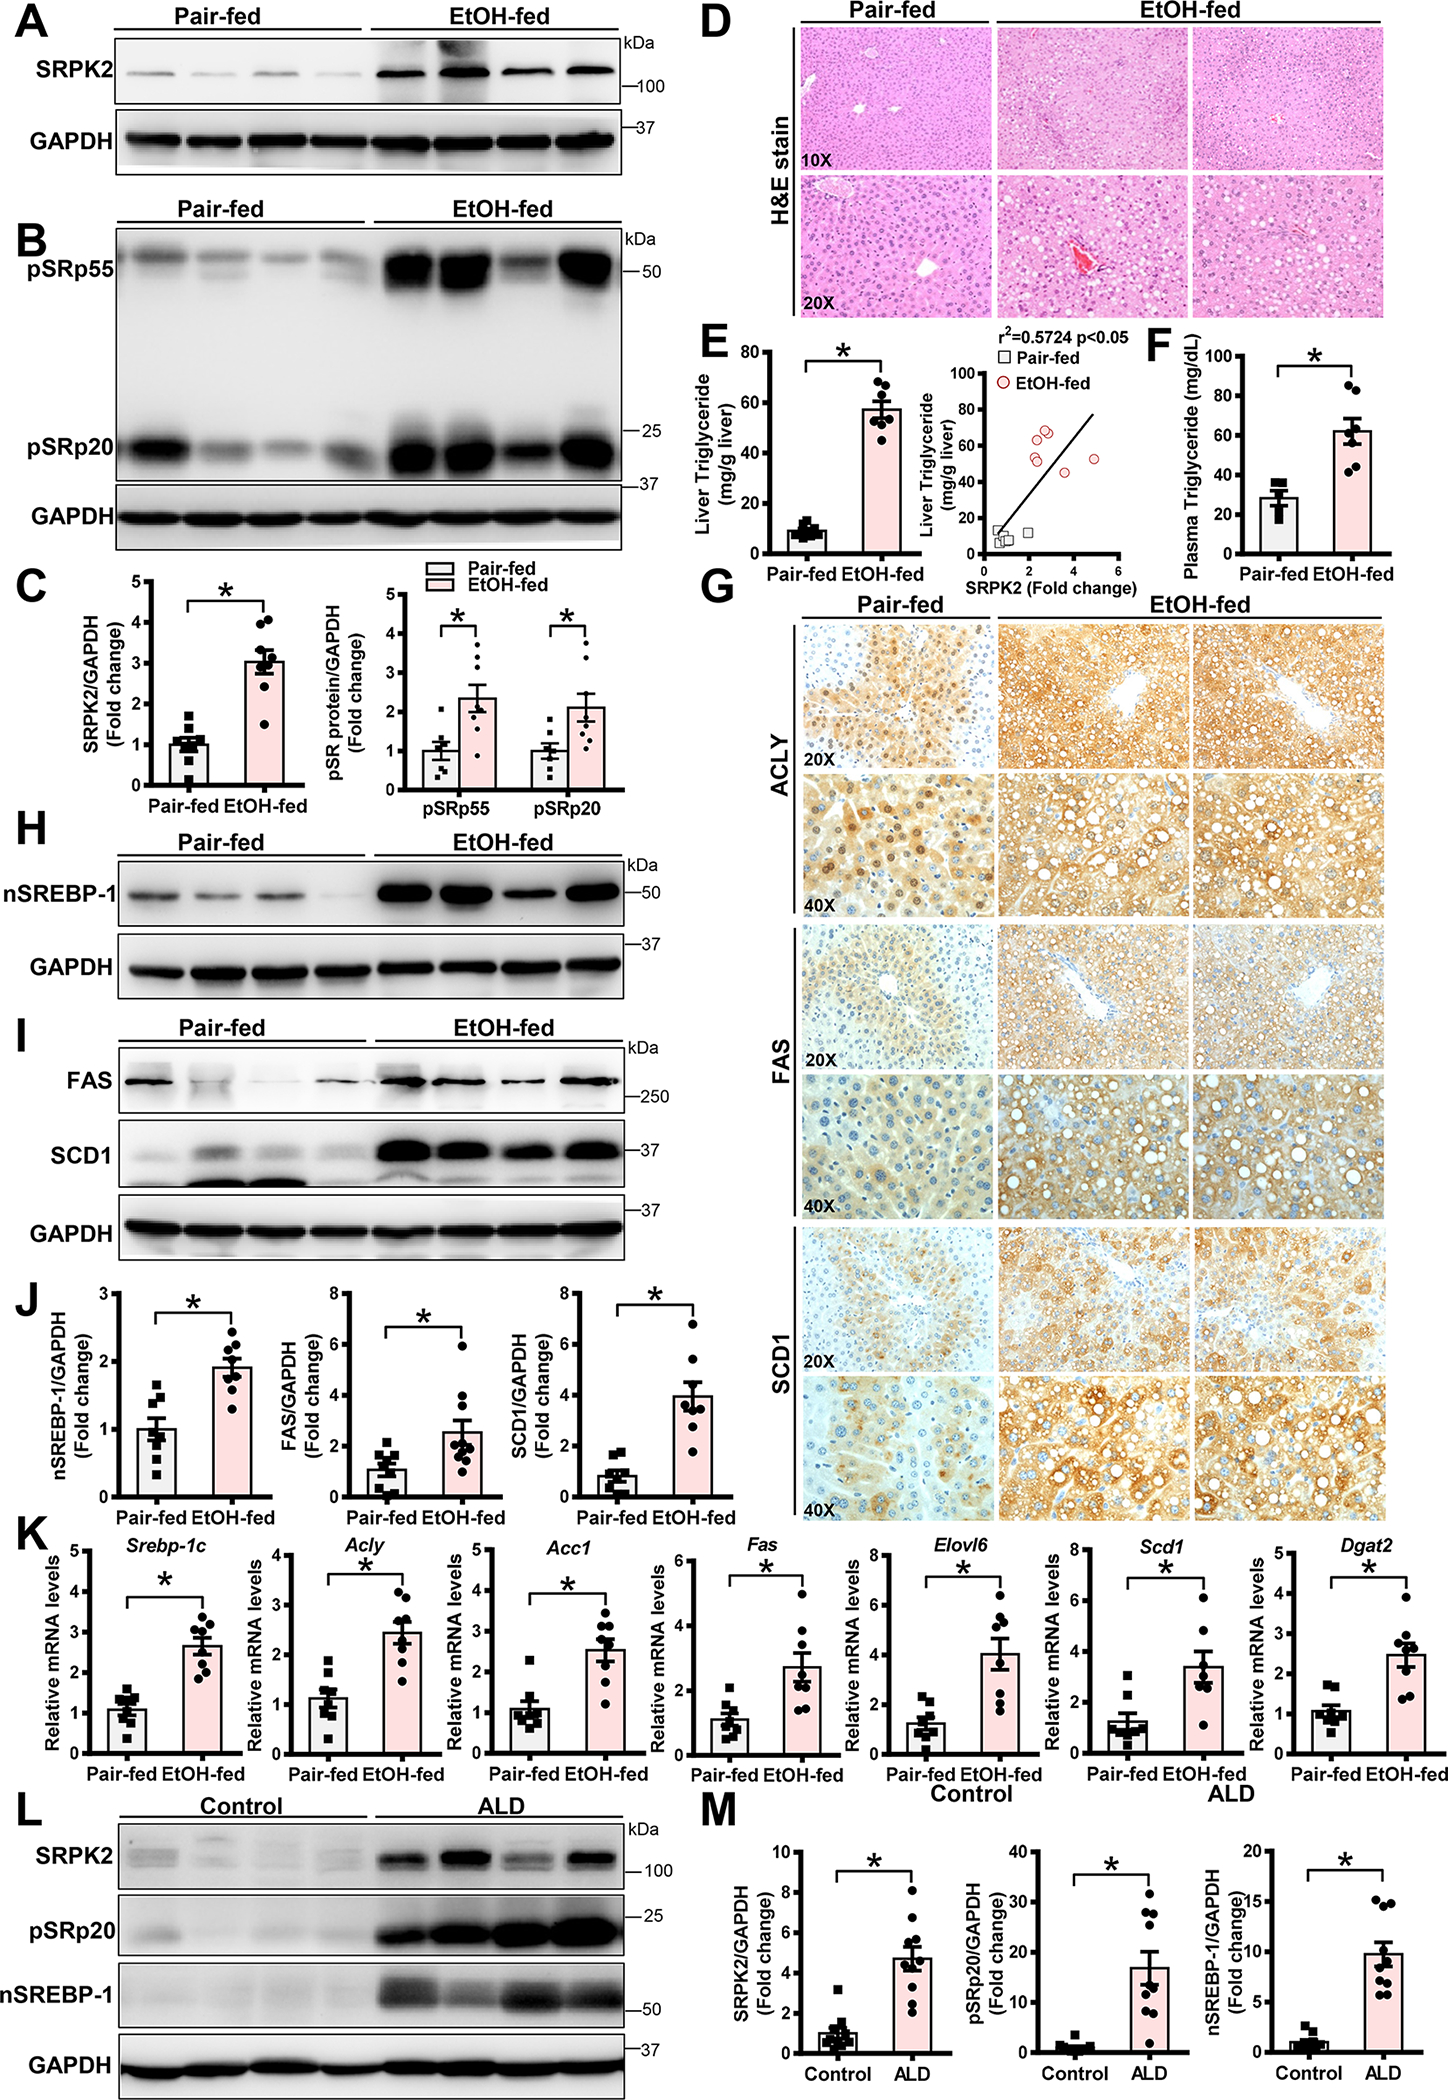
Fig. 1. Chronic alcohol consumption increases hepatic SRPK2 levels and activity, stimulates SREBP-1 cleavage, and upregulates transcription of SREBP-1-dependent lipogenic genes in a pre-clinical mouse model and in human liver samples.

A-C. Representative immunoblots for SRPK2 levels (A) and kinase activity (B), as assessed by phosphorylation of its downstream targets, including SR proteins (pSRp55) and (pSRp20), in livers from pair-fed mice and chronic-binge alcohol-fed mice. Levels of SRPK2 and SR protein phosphorylation (C) were quantified by densitometry, normalized to those of GAPDH, and presented as the fold change relative to the control.
D. Representative Hematoxylin & Eosin (H&E) staining of liver sections in mice.
E-F. Measurements of liver and plasma triglyceride concentrations. Liver lipids were extracted, and triglyceride concentrations were measured and expressed as mg of lipid/g of liver tissue. Hepatic triglyceride levels were positively correlated with SRPK2 levels in pair-fed and chronic-binge alcohol-fed mice.
G. Representative immunohistochemistry staining of liver sections for lipogenic enzymes including ACLY, FAS, and SCD1. Notably, positive staining for ACLY was much higher in the cytoplasm and nucleus of lipid-rich hepatocytes of chronic-binge alcohol-fed mice. Positive staining for FAS and SCD1 was primarily located in the cytoplasm of lipid-rich hepatocytes in chronic-binge alcohol-fed mice.
H-J. Representative immunoblots for nuclear SREBP-1 (nSREBP-1), FAS, and SCD1. The active, nuclear form of SREBP-1 and expression of its target genes, FAS and SCD1, were increased in chronic-binge alcohol-fed mice.
K. Real-time qRT-PCR analysis of mRNA levels of lipogenic genes, including SREBP-1c, ACLY, ACC1, FAS, ELOVL6, SCD1, and DGAT2.
The data are presented as the mean ± S.E.M., n=6–8 per group. *P<0.05, vs pair-fed mice.
All images were acquired using 10X, 20X, or 40X objectives.
L-M. Representative immunoblots for SRPK2, pSRp20, and nuclear SREBP-1 in livers of healthy human controls and in patients with ALD.
The data are presented as the mean ± S.E.M., n=10 per group. *P<0.05, vs. healthy human controls.
