Figure 1:

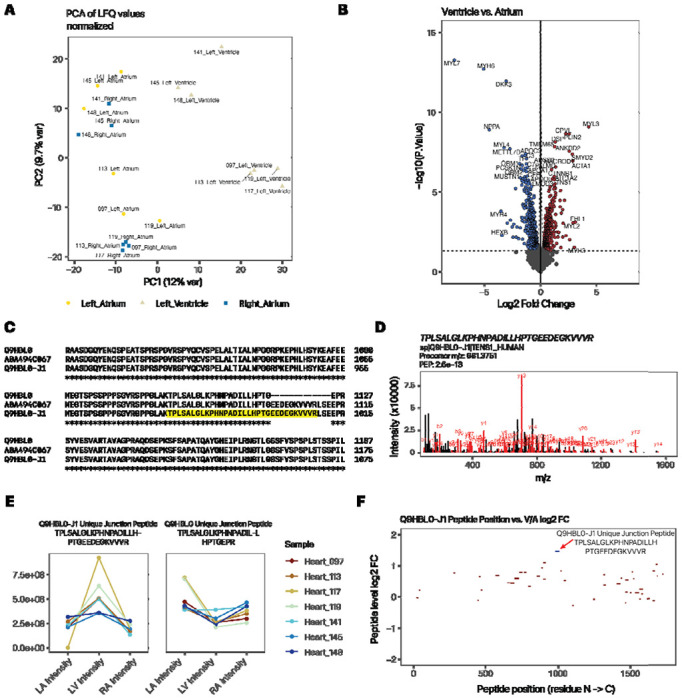
Quantification of atrium and ventricle distributions of protein isoforms show tissue usage preferences. A. PC1 vs. PC2 of custom database search, recapitulating the atrial-ventricular separation of total protein profiles. B. Volcano plot (log2FC vs. −log10 P) showing top differentially expressed proteins that are more highly expressed in the ventricle (right) or atrium (left) of the heart. C. ClustalOmega alignment of canonical tensin 1 (TNS1; Q9HBL0) and the custom translated isoform, which corresponds to the TrEMBL sequence A0A494C067 within the relevant splice junctions. D. Peptide spectrum match of the Tensin-1 isoform junction peptide. E. Line plots showing normalized protein expression in the left atrium (LA), left ventricle (LV), and right atrium (RA) of the splice junction-spanning peptide unique to the tensin-1 alternative isoform (left) vs. the corresponding junction-spanning peptide of the canonical form (right). Color: individual donor. F. Map of unique peptide by their residue location (x-axis) within the tensin-1 isoform sequence and their relative ventricle to atrium (V/A) expression ratio (y-axis). The isoform-specific junction peptide is in blue. Red peptides are shared with the canonical sequence. Only peptides with 1e8 or above LFQ intensity are included.
