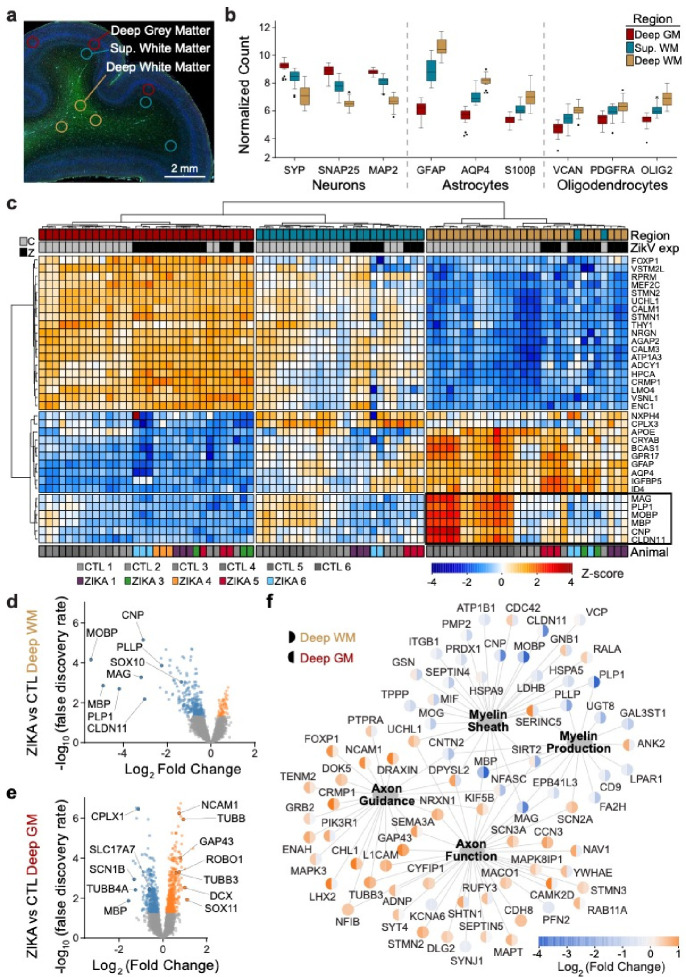
Fig. 1. Congenital Zika infection causes downregulation of myelination genes in deep white matter of nonhuman primate.
Digital spatial profiling (DSP) of tissue was conducted using the Nanostring GeoMx DSP platform, after immunofluorescence staining to identify regions of brain and cell types. a) ROIs were selected in triplicate for each brain, representing DGM (red), SWM (teal) and DWM (tan). b) Tukey plot representing normalized counts for selected genes classically expressed by neurons (left), astrocytes (center), and oligodendrocytes (right), according to ROI. c) Normalized gene expression (row-specific Z-score) of the top 35 differentially expressed (DE) genes identified in pair-wise comparison of samples across ROI and ZikV exposure. Samples (x-axis) and genes (y-axis) were clustered by calculating Euclidean distances using Ward.D2. Top row, color coding by ROI, as in panel b. Second row, color coding by exposure: grey, control; black, ZikV. Bottom row: color coding by animal. Black outline identifies genes in DWM, all of which relate to myelination. d-e) Volcano plots of DE genes comparing ZikV to control animals for ROIs representing d) DWM and e) DGM. Orange, significantly (FDR<0.05) upregulated in ZikV; blue, significantly downregulated in ZikV; grey, FDR>0.05 in DE comparison. f) Network of 79 DE genes (FDR<0.05) in either DWM or DGM clustered by gene ontology (GO, large nodes) representing axon function (GO:0030424 and GO:0007411) and myelination (GO:0042552 and GO:0043209). GO terms were selected by applying over-representation analysis (ORA) to DE genes in each cluster (Fig. S2a). Small nodes represent average log-fold change (color) for each gene in DWM (left half) and DGM (right half). Average gestational age (±SD) of ZikV-exposed vs CTL animals in DSP analysis=150(±9) vs 156(±2) days; p=0.14 by t-test for DGM; 154(±8) vs 156(±2) days; p=0.46 by t-test for DWM.

