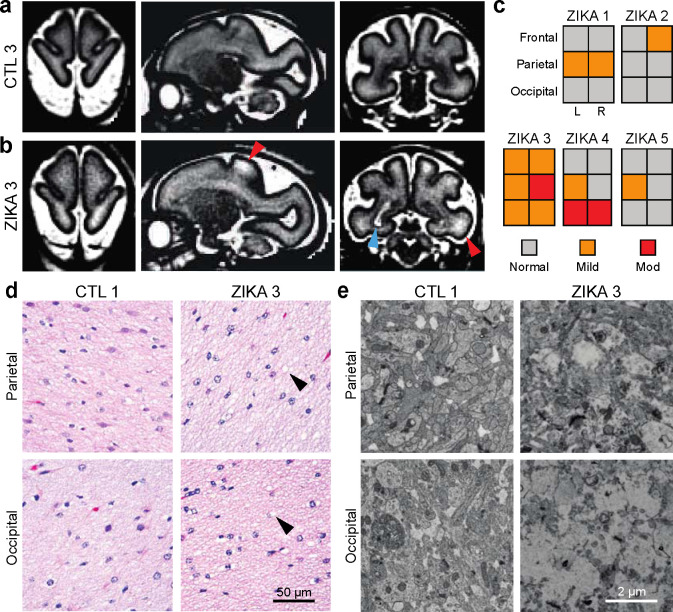
Fig. 3. Spatial heterogeneity of pathology in ZikV-exposed fetal NHP brain.
a-b, Representative T2-weighted MRI images (left, axial; middle, sagittal; right, coronal) for a) control and b) ZikV animals. MRI scans were collected at GD125 for CTL3 and GD120 for ZIKA3 (Fig. S1). Blue arrowhead indicates the “primary” periventricular lesion described previously29. Red arrowheads indicate T2-weighted (T2W) hyperintense foci in subcortical white matter, which can be seen in delayed, abnormal, or inflamed myelin. c) Ordinal scale of T2W intensity identified in the frontal, parietal and occipital lobes of Zika-exposed animals. Relative scale was established with normal appearance matching control animals and severe signal abnormality matching the T2W signal of the primary lesion. d) Representative hematoxylin and eosin (H&E) images of white matter at the level of parietal lobe (top) and occipital lobe (bottom) for control (left) and ZikV animals (right). Arrowheads indicate areas of vacuolization seen in the H&E staining of white matter of ZikV animals. e) Representative EM images of brain tissue collected from approximate focal areas with T2 signal at the level of parietal lobe (top) and occipital lobe (bottom) for CTL (left) and ZikV animals (bottom). MRI, magnetic resonance imaging.

