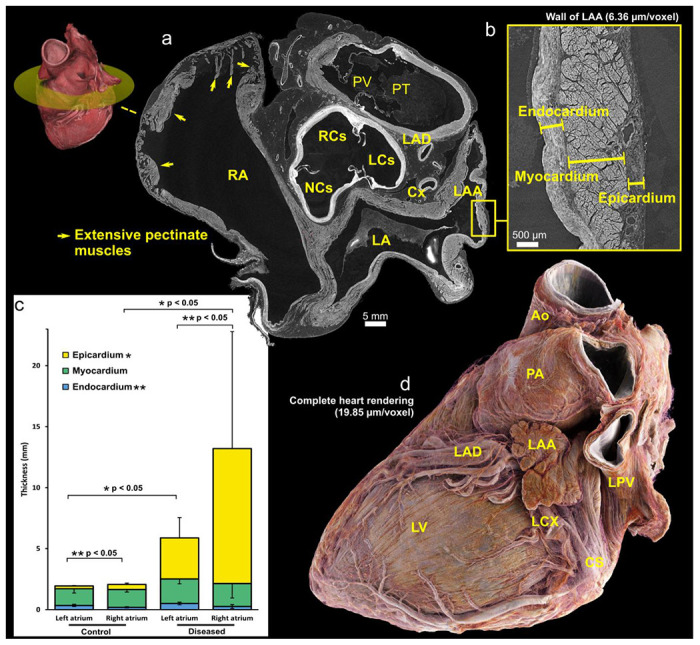
Figure 3:

(a), Short axis views of base of control heart with a 3D view indicating the location of the cross-section. (b) Cross-sections of high-resolution local tomography scans of the left atrial appendage wall of the control heart with a voxel size of 2.2 μm/voxel showing endocardial, myocardial and epicardial layers. (c), Graph showing 2D measurements of the atrial wall layers in left and right atria for both control and diseased hearts. The thickness measurements were obtained manually at ten distinct locations along the atrial wall. Statistical analysis revealed significant differences (p < 0.05) in the thickness of the left and right atrial endocardium for both control and diseased hearts. Similarly, significant differences (p < 0.05) in the epicardial thickness between control and diseased hearts were observed for both the left and right atria which may be due primarily to extent of epicardial fat. (d), 3D rendering of the control heart, with epicardial fat ‘removed’ digitally by thresholding images. The neck of the appendage can be seen running over the circumflex coronary artery – a key landmark for interventional closure of the left atrial appendage with devices used in the setting of atrial fibrillation, refractory to medical therapy for rate control, and with contra-indication to oral anticoagulants. CS – Coronary sinus; LA – Left atrium; LAA – Left atrial appendage; LAD – Left anterior descending (superior interventricular) coronary artery; LCS – Left coronary sinus; LCX – Left circumflex coronary artery; LV = Left ventricle; NCS – Non-coronary sinus; PA – Pulmonary artery; PT – Pulmonary trunk; PV – Pulmonary valve; RA – Right atrium; RCS – Right coronary sinus
