Figure 5:

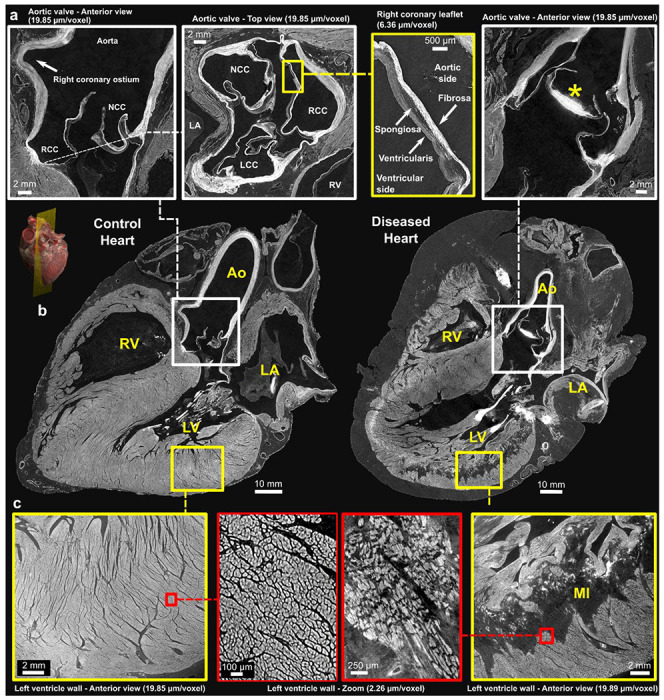
Comparison of control and pathological hearts – (b) Long-axis view of control and diseased hearts at imaging resolution of 20 μm/voxel. A 3D rendering provides a visualization of the imaging plane in which these views were created which is equivalent to a parasternal-long axis section. Zoomed-in images of the aortic valve and left ventricular wall are shown in (a) and (c), respectively. The yellow squares indicate images captured at a resolution of 6.5 μm/voxel, while the red squares indicate images captured at a higher resolution of 2.2 μm/voxel. The different layers of the aortic valve, the fibrosa, spongiosa, and ventricularis, can be clearly delimited along with calcification of the non-coronary leaflet in the diseased heart (*). The arrangement of the cardiomyocytes is also clearly seen in (c) with altered structure and darker areas consistent with replacement fibrosis within an extensive myocardial infarction. Ao - Aorta, LA - left Atrium, RA - Right Atrium, LV - left Ventricle, RV - Right Ventricle; MI - Myocardial Infarction, NCC - Non-Coronary Cusp, RCC - Right Coronary Cusp, LCC - Left Coronary Cusp. Note: The left atrium appears collapsed in both hearts.
