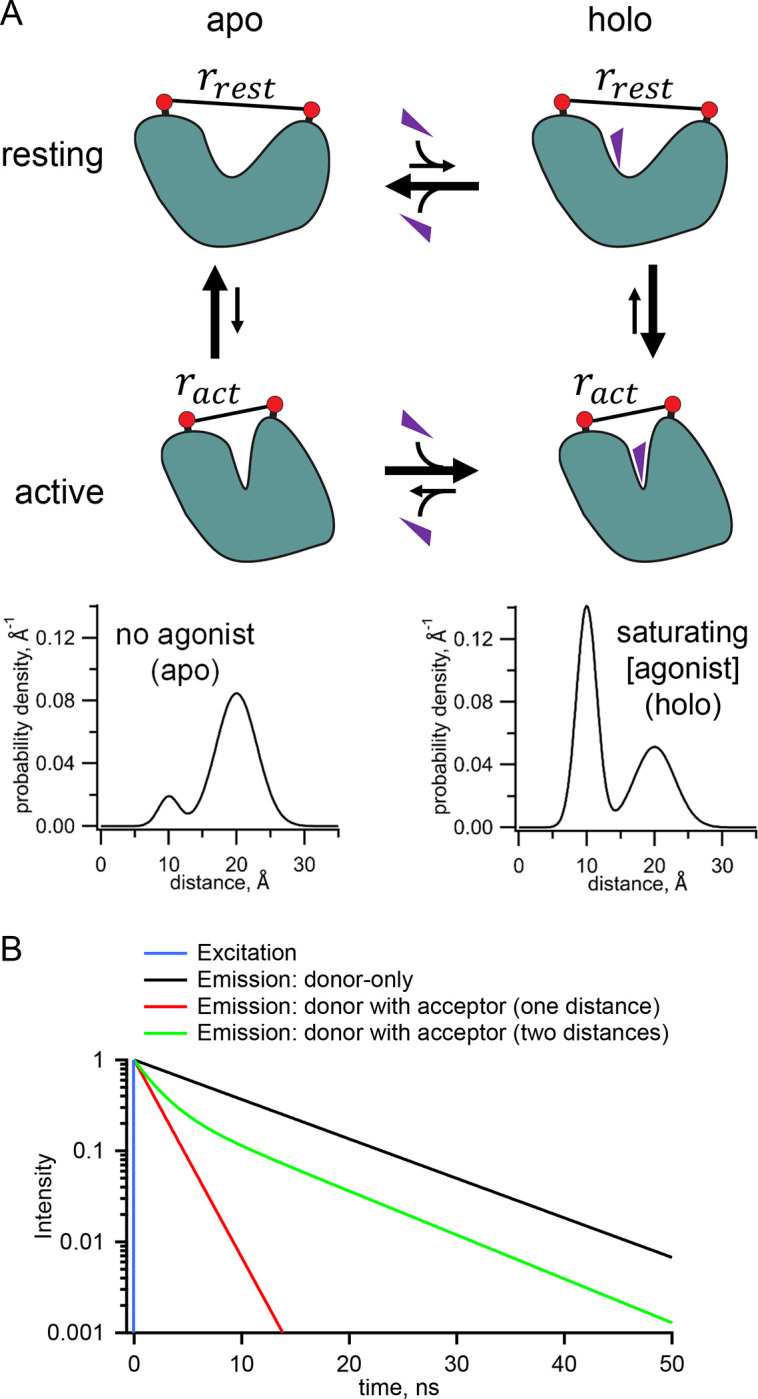
Figure 1.

Measurement of distance distributions for an allosteric protein. (A) Conformational states (top) and distance distributions (bottom) for a stereotypical allosteric protein. The red circles represent the FRET probes and the purple triangles the ligand. (B) Theoretical effect of FRET with one or two distances on the fluorescent lifetimes in the time domain.
