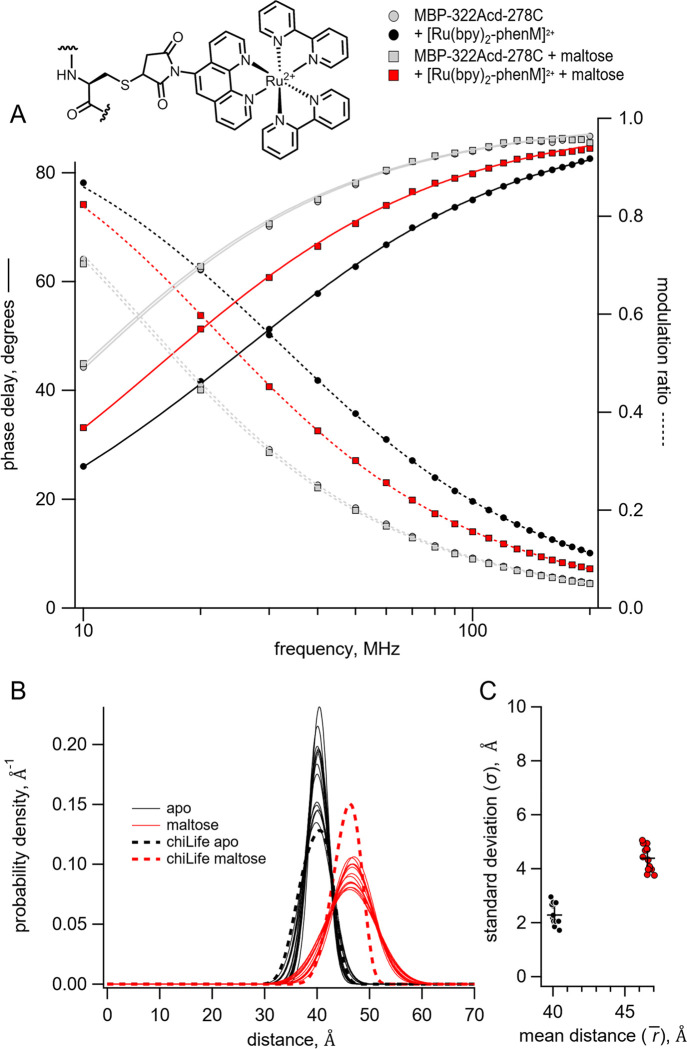
Figure 2.
Time-resolved tmFRET of MBP-322Acd-278C labelled with [Ru(bpy)2phenM]2+. Structure of [Ru(bpy)2phenM]2+ label on the protein and legend for all panels are shown at the top. (A) Weber plot of the fluorescence lifetimes with 0 and 3 mM maltose in the presence and absence of [Ru(bpy)2phenM]2. (B) Spaghetti plot of the distance distributions measured by time-resolved tmFRET (thin solid curves) with 0 and 3 mM maltose (n=14) compared to the predicted distributions from chiLife for the resting and active state (dashed curves). (C) Scatter plot of the standard deviation vs. the mean distance for the Gaussian distributions with 0 and 3 mM maltose (n=14). The average values are shown as black +.

