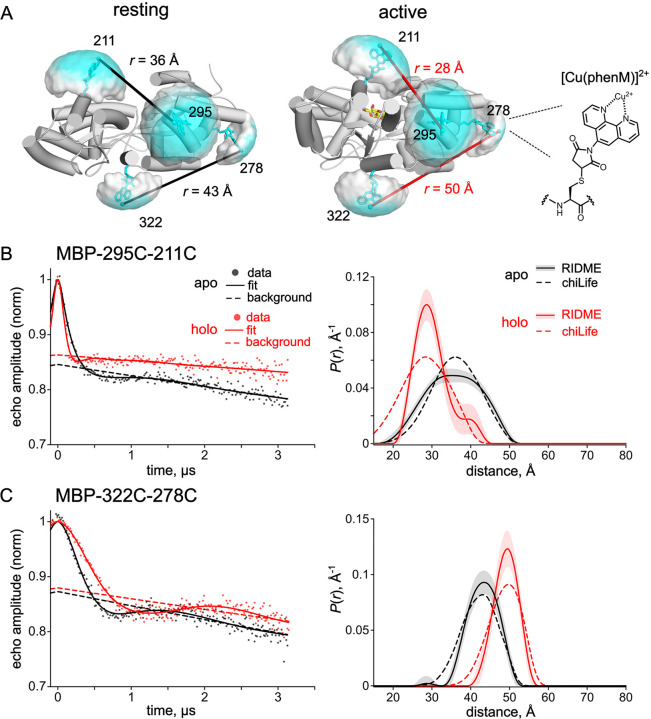
Figure 6.
Pulse dipolar EPR distance distributions with the [Cu(phenM)]2+ spin label. (A) Cartoon representations of resting state (pdb 1omp) (35) and active state (pdb 1anf) (34) of MBP labeled in silico with [Cu(phenM)]2+ at 295C, 322C, 211C, and 278C using chiLife. Rotameric clouds are represented as surfaces and colored on a gradient from low (white) to high (cyan) probability. Predicted most probable distances determined by chiLife for the MBP-295C-211C and MBP-322C-278C site pairs are indicated. The structure of the spin-labeled [Cu(phenM)]2+ side chain is shown at right. (B, C) 5-pulse RIDME time-traces and calculated distance distributions for [Cu(phenM)]2+-labeled MBP-295C-211C (B) and MBP-322C-278C (C) in the absence of maltose (apo, black) and in the presence of 5 mM maltose (holo, red). Dashed curves on the distance distribution plot are predicted distributions calculated with chiLife. Shaded error bands on the RIDME distance distributions represent 95% confidence intervals determined from the DeerLab fits.

