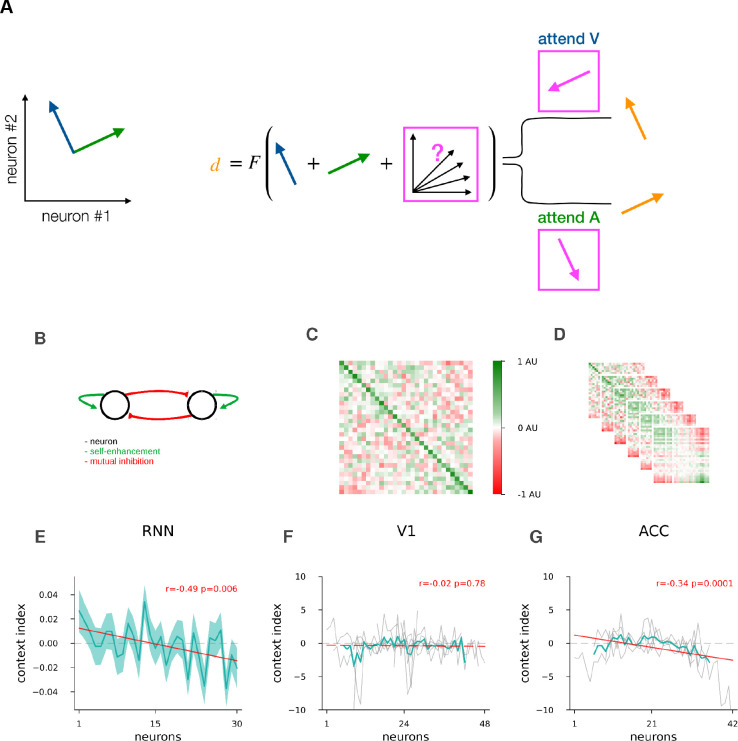
Figure 5. Context gated mutual feedback mechanism.
A, Schematics of a context-selective inhibition mechanism when representations can be approximated by linear subspaces. At the level of primary sensory areas, the total stimulus space consists of unrestrained activities along each subspace (blue and green, left). In order to map the total stimulus space to the abstract decision space (orange, right) in a contextually correct way with fixed weights, the activity in the irrelevant subspace has to be inhibited (pink, middle). B, Schematics of mutual feedback in the total stimulus subspace represented by an axis aligned two dimensional system: two neurons with mutual inhibition and positive self-enhacement. C, Recurrent weight matrix of RNN models; neurons ordered by their modality index defined as input weight difference between visual and auditory stimuli. Colormap rescaled by the largest of absolute minimum or maximum (AU). Neurons ordered separately for ‘go’ and ‘no go’ signals, then averaged, mean of n=100 models. D, same as C, but also the 2nd to 6th power of the recurrent weight matrix on C, approximating its final recurrent effect from stimulus onset until decision requirement, colormap rescaled, units as in C. E, Context index defined as difference of neural activity between the visual and auditory context; neurons ordered by the modality index, for RNN models, using input weight modality index as in C,D, mean and s.e.m. over models, n=88 that have performance > 0.9 fraction correct. Values calculated and neurons ordered separately for ‘go ‘ and ‘no go’ signals, then averaged. F, same as E, but mouse modality index was defined as trial-averaged response difference between visual and auditory stimulus, when presented in the absence of the other stimulus. Mice had varying numbers of neurons, with the neuron index set at the midpoint of the number of neurons for display purposes. In V1, Individual mice (n=8, grey lines), mean over mice skipping 4 start and end neuron order positions on each side (turquoise), and linear fit to mean over mice (red). G, same as F, but for mice recorded at the ACC site, n=4.

