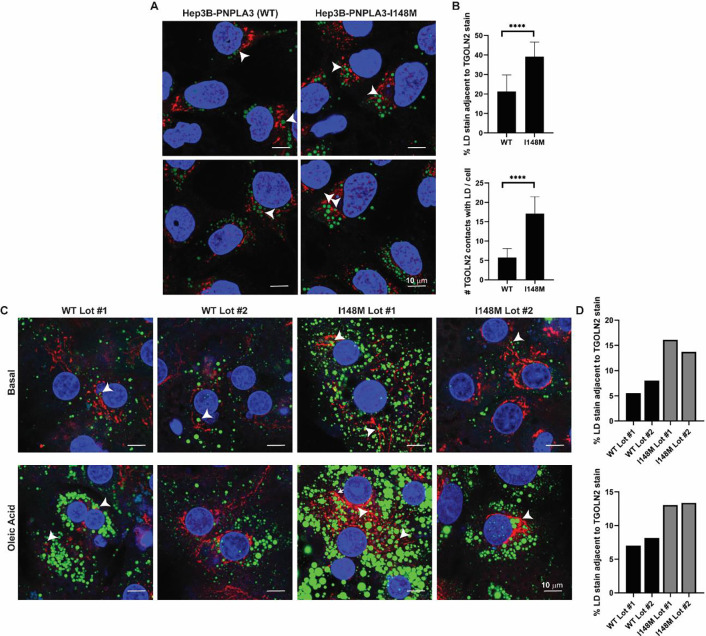
Figure 4. Hepatoma cells and primary hepatocytes expressing PNPLA3-I148M have more LD-Golgi contacts.
(A) Hep3B cells expressing endogenous PNPLA3 or PNPLA3-I148M were fixed and stained with LipidTOX Green to label LDs (green) and TGOLN2 (red) to label the trans-Golgi network. White arrowheads indicate examples of LD-TGOLN2 interactions. (B) Lipid droplet-TGOLN2 contact sites in ~ 45 cells per cell line were quantified using Imaris software. p-values were calculated from Student’s t-tests. (C) Individual lots of primary human hepatocytes expressing wild-type PNPLA3 or PNPLA3-I148M were plated, treated with vehicle or 200 μM oleic acid for 24 h, fixed and stained with LipidTOX Green to label LDs (green) and anti-TGOLN2 (red) to label the trans-Golgi network. White arrowheads indicate examples of LD-TGOLN2 interactions. (E) 20–40 cells of each lot and condition were quantified and LD-TGOLN2 proximity was calculated using Imaris software. Percentage of LD stain juxtaposed to TGOLN2 stain for untreated cells (top) and oleic acid-treated cells (bottom) per primary hepatocyte lot. WT (black) and I148M (gray) lots are indicated. Each bar represents the average of 11 fields of view for each primary hepatocyte lot per condition. **** p < 0.0001.

