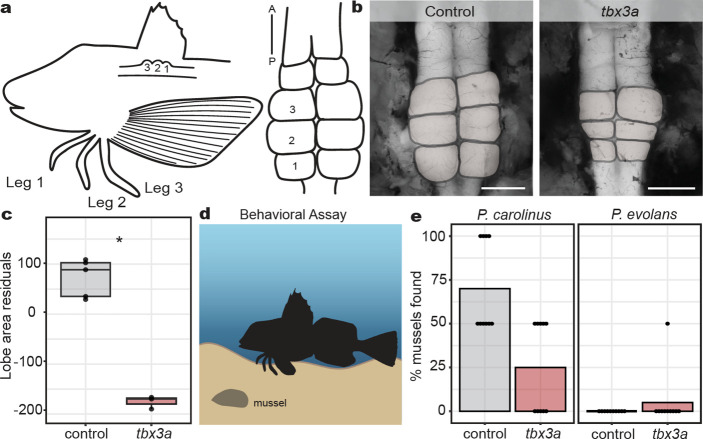
Fig. 3: Effects of tbx3a mutation on leg neural architecture and behavior.
a, Diagram of the 1:1 innervation relationship between sea robin legs and CNS lobes. b, Representative examples of control and tbx3a crispant lobes (lobes pseudo colored in gray). c, Lobe area was reduced in tbx3a crispants as measured by regressing against standard length (N = 5 control animals and N = 3 tbx3a crispants, P = 0.04 by Wilcoxon rank sum test). d, Schematic of behavioral assay used to test sensory behavior of sea robins (created with biorender). e, Digging behavior was reduced in tbx3a crispants versus control P. carolinus, closer to levels of non-digging P. evolans controls that were unaffected by tbx3a disruption. Two mussels were buried per trial. Discovery of both mussels resulted in a score of 100% while uncovering one mussel was scored as 50%. N = 10 trials across 6 animals per genotype used in analysis. Scale bars, 1 mm (b, both images).

