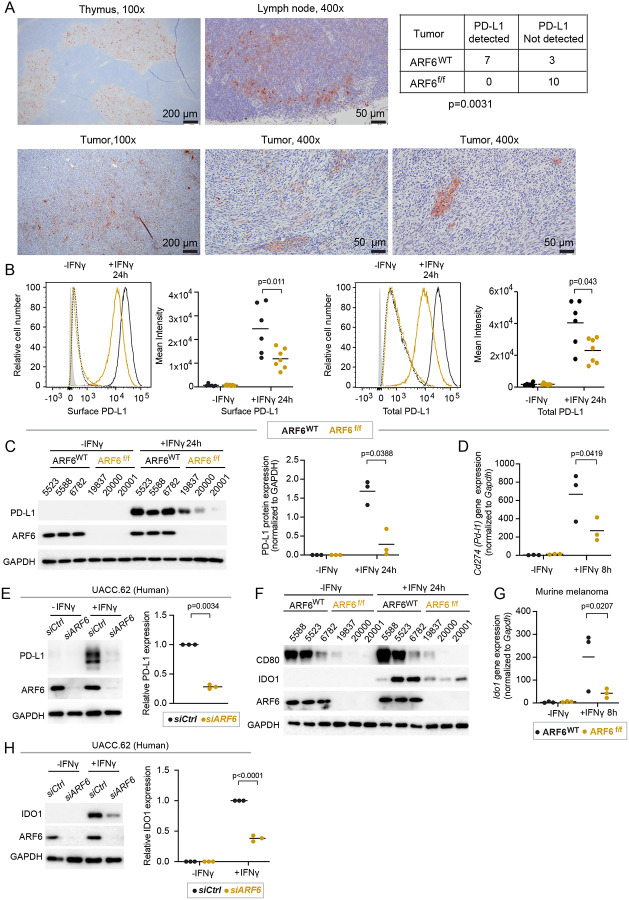
Figure 5: Activation of ARF6 and expression of immunosuppressive genes downstream of IFNγ.
(A) Representative images of immunohistochemical (IHC) detection of PD-L1 in ARF6WT tumors and summary of PD-L1 detection in n=10 tumors of each genotype tested, two-sided Fisher’s exact test. Thymus and lymph node are used as controls, (B-D) IFNγ-induced PD-L1 expression in early-passage murine tumor cell lines. (B) Flow cytometric detection of tumor cell surface and total protein, n=6–7 independent cell lines of each genotype. (C) Western blot for indicated proteins, n=3 independent cell lines of each genotype. (D) Quantitative RT-PCR analysis for Cd274 mRNA, one tumor cell line of each genotype, n=3 replicates each. (E) Western blot for indicated proteins in UACC.62 cells, n=3. (F) Western blot for indicated proteins in early-passage murine tumor cell. (G) Quantitative RT-PCR for Ido1 mRNA in one tumor cell line of each genotype, n=3 replicates each. (H) Western blot for indicated proteins in UACC.62, n=3 biological replicates. (B, C, D, G) Two-way ANOVA with Tukey’s multiple comparisons test. (E, H) Ratio paired t-test. See also Figure S5.

