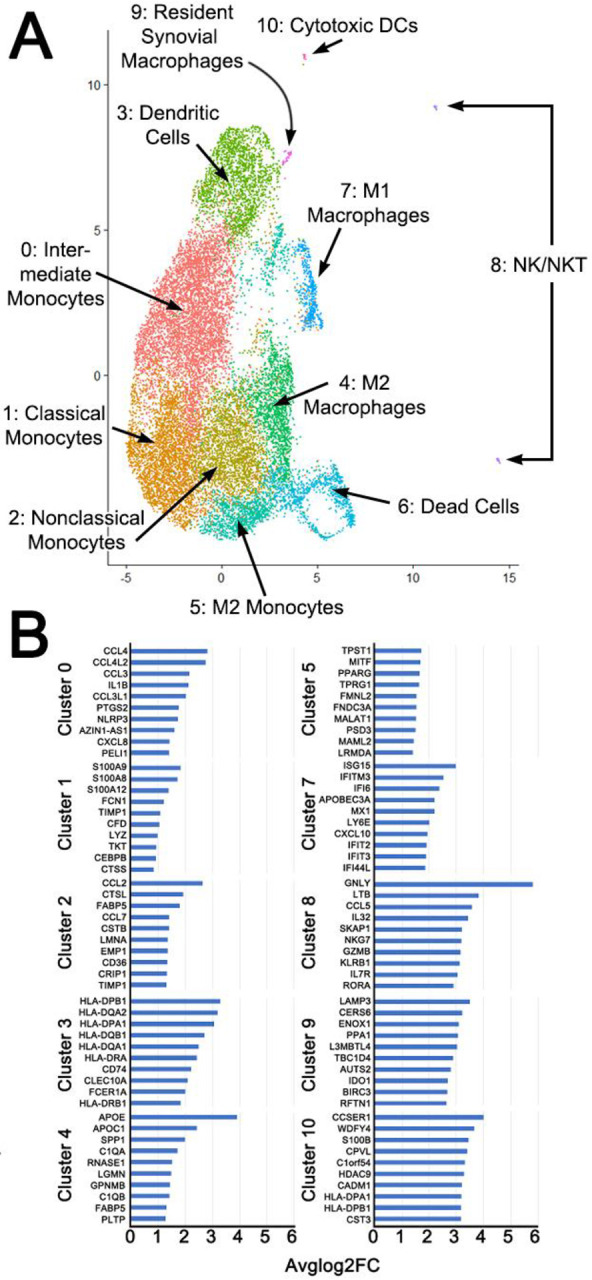
Figure 4:

Unsupervised Cluster Analysis showing composite of 3 patients with inflammatory arthritis (A). Clusters were manually identified based on top ten expressed genes (B) in addition to classical markers. Analysis performed in R with resolution of 0.4 and dimensions 1:30. N = 3 patients per inflammatory and septic arthritis.
