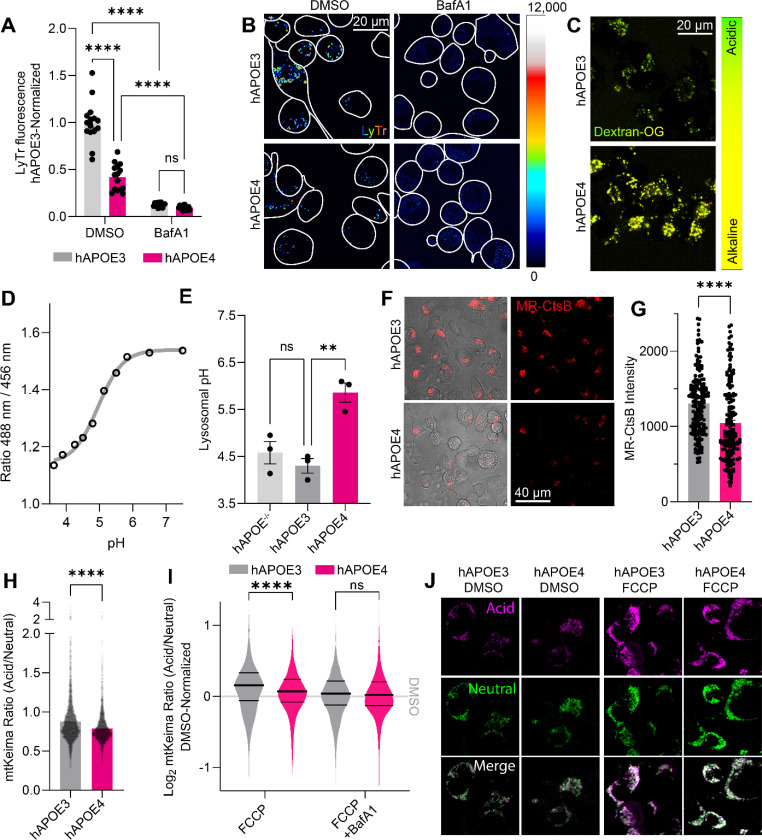
Figure 1: ApoE4 expression impairs lysosomal function.
(A) LysoTracker Deep Red was used to stain acidic compartments of hAPOE-expressing Neuro-2a cells. Staining intensity was calculated per cell, and summarized for each image, across three independent experiments. Bafilomycin A1 was used to block lysosomal acidification, decreasing the lysotracker staining intensity. (B) Representative images for (A). (C) Images of lysosomal pH measurements in hAPOE-expressing Neuro-2a cells using OregonGreen-70,000 kDa Dextran. (D) Standard curve for the OregonGreen ratio to pH conversion. (E) Lysosomal pH values measured by OregonGreen experiments. Data points represent individual experiments. (F) Images of Magic Red-Cathepsin B (MR-CtsB)-stained hAPOE-expressing Neuro-2a cells, indicating lysosomal proteolysis. (G) MR-CtsB quantification of proteolytic cleavage, as shown in panel (F). Data points indicate individual mitochondria across three independent experiments. (H) Basal mtKeima measurements from hAPOE-expressing Neuro-2a cells. Data points represent individual mitochondria imaged across three independent experiments. (I) Log2-transformed mtKeima ratios normalized to genotype DMSO controls, following 1-hour mitophagic induction by FCCP and BafA1 to inhibit lysosomal acidification, plotted as a density plot of analyzed mitochondria across three independent experiments. Thick central line indicates the experimental mean, thinner flanking lines indicate the 1st and 3rd quartiles. (J) Representative images for (I). All experiments were performed as three independent technical and biological replicates, and analyzed in Fiji. The data was plotted as means with SEM error bars, and analyzed in GraphPad Prism by 2-way ANOVA followed post-hoc by Bonferroni’s multiple comparisons test (A,E,G,I) or an unpaired, two-tailed t-test (H).**P<0.01, ****P<0.0001.

