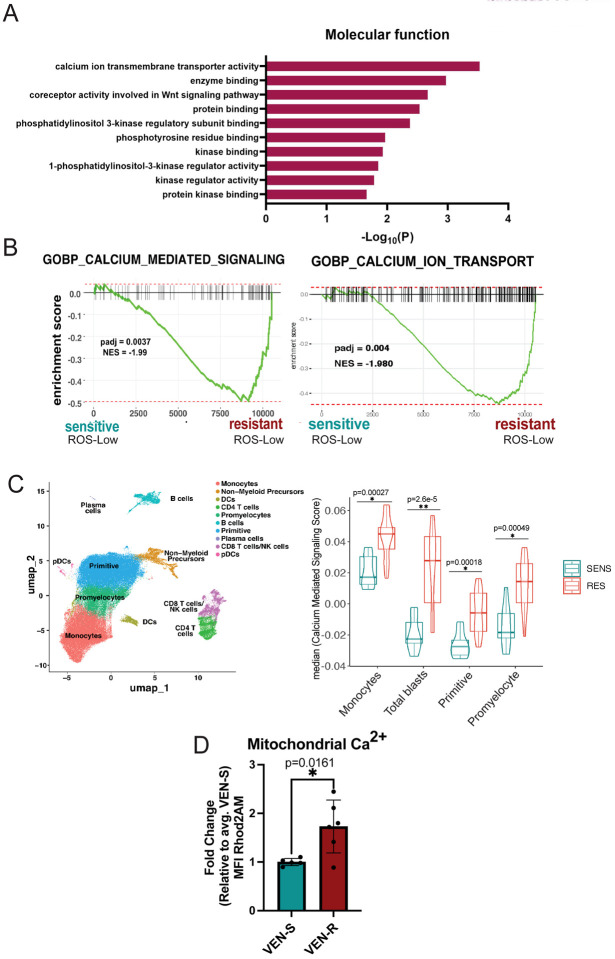
Figure 1. Venetoclax Responsiveness is Associated with Intrinsic Differences in Calcium Pathway Signaling.
A. BCL-2 interacts with signaling proteins using BioID in T-REx HEK293 cells. Pathway enrichment analysis of BCL-2 proximity interactors involved in cellular signaling. Gene ontology (Molecular Function) analysis shows the top 10 enrichment pathways. B. Enrichment plot for GOBP Calcium Mediated Signaling pathway (198 genes) and GOBP Calcium Ion Transport (455 genes) in N=7 venetoclax sensitive primary human AML ROS-Low cells and N=5 venetoclax resistant primary human AML ROS-Low cells C. Projection of all samples with cluster assignments annotated. In various populations of tumor including, monocytes, primitive cells, promyelocytes, and total blasts (a combination of monocytes, primitive cells and promyelocytes) GO-BP Calcium Mediated Signaling Pathway expression was analyzed using Seurat’s AddModuleScore function in sensitive (n=8) versus resistant (n=12) AML patient specimens with median plotted. Significance was determined using t-test. D. Mitochondrial calcium levels in venetoclax resistant primary human AML ROS-low cells compared to sensitive ROS-low cells presented as mean fluorescence intensity (MFI). N=5 venetoclax sensitive (AML 2,4,6,7,18) and n=6 venetoclax resistant (AML 1,3,11,12,13,14) cells. Data are presented as mean +/− SD. Significance was determined using two-tailed unpaired t-test.

