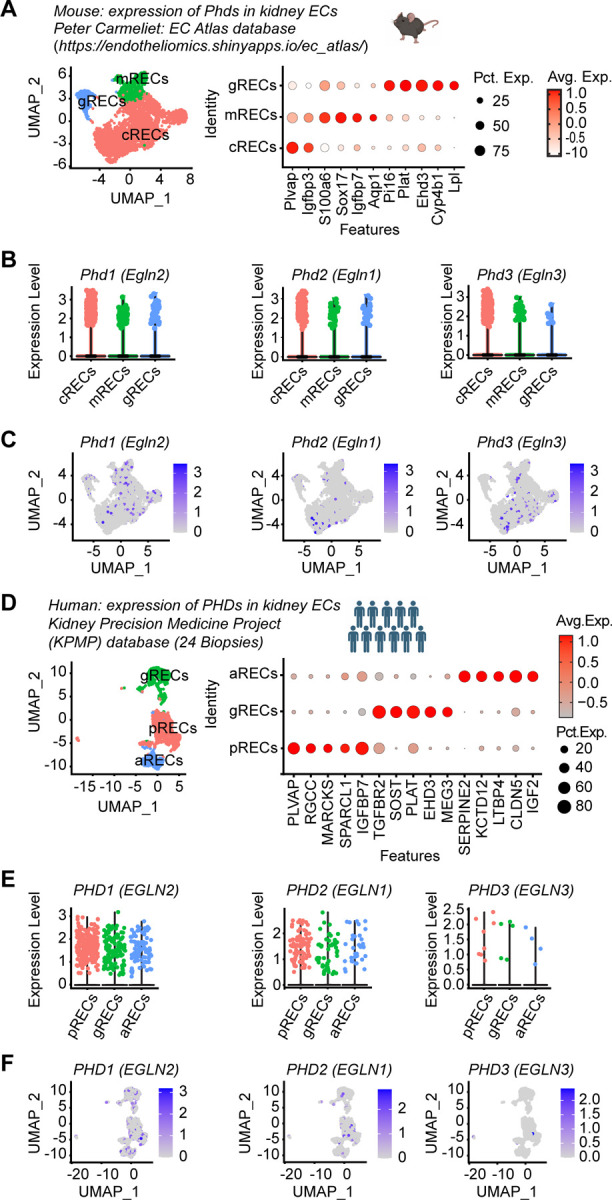
Figure 2. scRNA-seq analysis shows differential expression of PHD1, PHD2 and PHD3 in kidney ECs in mouse and humans.

(A-C) scRNA-seq analysis of RECs extracted from mouse EC Atlas database (https://endotheliomics.shinyapps.io/ec_at-las/). (A) Uniform manifold approximation and projection (UMAP) plot shows three EC clusters; cortical RECs (cRECs), medullary RECs (mRECs) and glomerular RECs (gRECs). Dot plot displays gene expression patterns of cluster-enriched markers. Violin plots (B) and feature plots (C) show the expression of Phd1 (Egln2), Phd2 (Egln1) and Phd3 (Egln3) in murine RECs. (D-F) scRNA-seq analysis of RECs extracted from normal human kidney biopsies (n=24). (D) UMAP plot shows arteriolar RECs (aRECs), glomerular RECs (gRECs) and peritubular RECs (pRECs). Dot plot illustrates gene expression patterns of cluster-en-riched markers. Violin plots (E) and feature plots (F) show the expression of PHDs in different RECs clusters.
