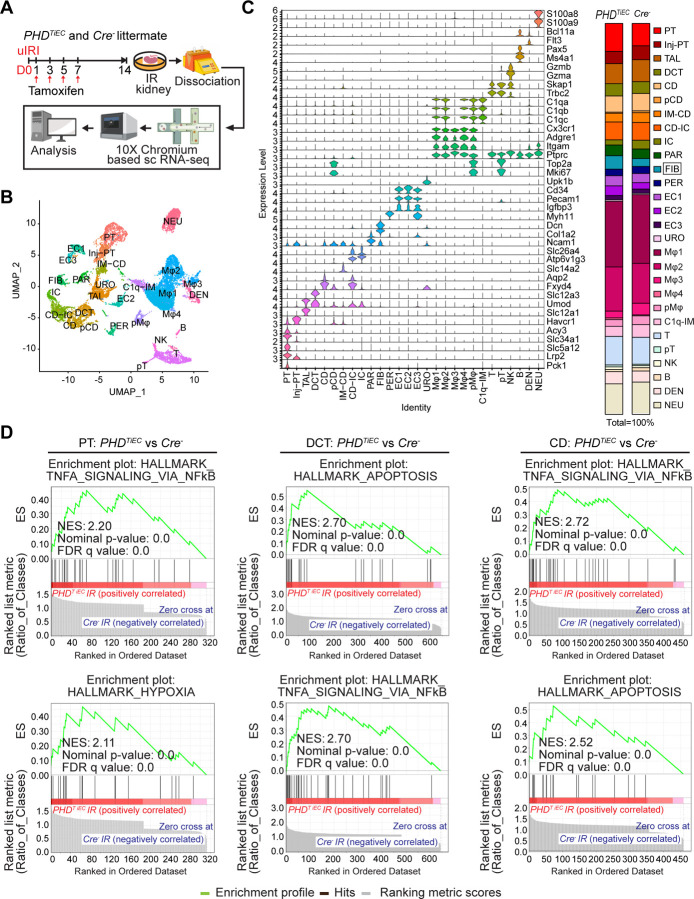
Figure 4. scRNA-seq analysis reveals the cellular landscape of day 14 post-ischemic kidneys of PHDTiEC and control mice.
(A) Scheme illustrating the experimental strategy applied for scRNA-seq analysis. A PHDTiEC mouse and a Cre− littermate were subjected to 25 minutes of unilateral renal artery clamping. Treatment with tamoxifen was started on day 1 post uIRI and involved 4 IP doses given every other day. Mice were sacrificed for scRNA-seq analysis on day 14 post uIRI. IR kidneys were isolated and single cell suspension was prepared and used for scRNA-seq analysis (n=1 per genotype). (B) Uniform manifold approximation and projection (UMAP) plot representation of the cell classification in day 14 post-ischemic kidneys from PHDTiEC and Cre− mice. (C) Violin plots display characteristic marker genes for each identified cell population. Right side bar plot shows cell proportions in day 14 post-ischemic kidneys from Cre− and PHDTiEC mice. Highlighted is the increased proportion of fibroblasts in PHDTiEC post-ischemic kidney compared to Cre− control. Proximal tubule (PT), Injured proximal tubule (Injured-PT), Thick ascending limb (TAL), Distal convoluted tubule (DCT), Collecting duct (CD), Proliferating CD (pCD), Inner medullary collecting duct (IM-CD), Collecting duct-intercalated cells (CD-IC), Intercalated cells (IC), Parietal cells (PAR), Fibroblasts (FIB), Pericytes (PER), Endothelial cells 1–3 (EC1–3), Urothelial cells (URO), Macrophages 1–4 (Mφ1–4), Proliferating macrophages (pMφ), C1q (C1qa, C1qb and C1qc) expressing immune cells (C1q-IM), T cells (T), Proliferating T cells (pT), Natural killer cells (NK), B cells (B), Dendritic cells (DEN), and Neutrophils (NEU). (D) Top 2 enriched Hallmark pathways emerged in GSEA (gene set enrichment analysis) hallmark analysis of differentially expressed genes (DEGs) for PT, DCT and CD clusters of PHDTiEC post-ischemic kidney as compared to Cre− control.

