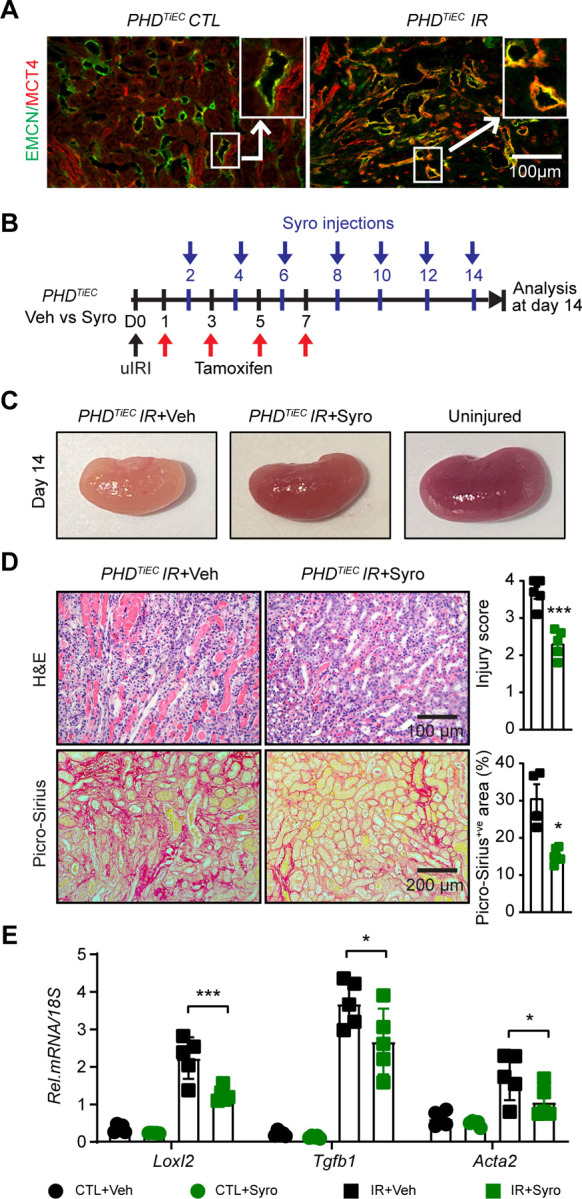
Figure 7. Post-IRI treatment with the MCT4 inhibitor syrosingopine restores adaptive kidney repair in PHDTiEC mice.

(A) Representative images of immunofluorescence staining for MCT4 (red) and EMCN (green) of contralateral and day 14 post-ischemic kidneys from PHDTiEC mice. Zoom-in panels show the increased expression of MCT4 in EMCN+ve cells in PHDTiEC post-ischemic kidney. Images were captured using a Nikon Ti2 Widefield fluorescence microscope. Scale bar, 100 μm. (B) Scheme shows the experimental protocol used. PHDTiEC mice were subjected to 25 minutes of unilateral renal artery clamping. Tamoxifen was started on day 1 post uIRI and was given every other day until day 7 post uIRI. Treatment with syrosingopine was started at day 2 post uIRI and was given every other day until day 14, when mice were sacrificed for histopathological and molecular analysis. (C) Representative images of uninjured kidney compared to day 14 post-ischemic kidneys treated with vehicle, or syrosingopine. All mice are PHDTiEC mutants. (D) Representative images of H&E and Picro-Sirius red stained day 14 post-ischemic kidneys from vehicle-vs syrosingopine-treated PHDTiEC mutants. Right: Tubular injury score and semiquantitative analysis of Picro-Sirius red+ve area of day 14 post-ischemic kidneys for the indicated experimental groups. Scale bars indicate 100 μm and 200 μm for H&E and Picro-Sirius red images, respectively. (E) mRNA levels of Loxl2, Tgfb1 and Acta2 in CTL and IR kidneys from vehicle or syrosingopine-treated PHDTiEC mice on day 14 after uIRI. Data are represented as mean ± SEM. For (D), statistics were determined by unpaired t-test with Welch’s correction. For (E), statistics were determined using one-way ANOVA with Sidak correction for multiple comparisons. n=4–5; *, P< 0.05; ***, P< 0.001. uIRI, unilateral IRI; CTL, contralateral kidney; IR, kidney subjected to IRI; Veh, vehicle; Syro, syrosingopine.
