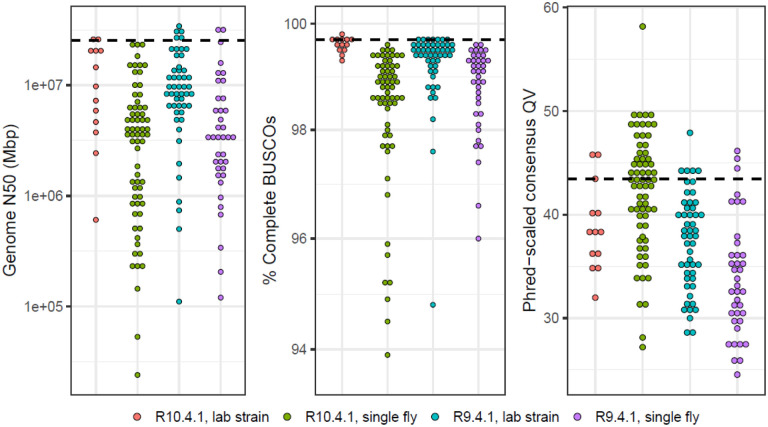
Figure 4.
The distribution of genome quality metrics for 168 new long-read assemblies. Distributions of genome N50, the percentage of complete dipteran BUSCOs (Manni et al., 2021), and Phred-scaled QV are plotted separately for R10.4.1 and R9.4.1 assemblies from lab strains and from single flies. The black dashed line is the value computed for the D. melanogaster dm6 reference genome. The 16 samples that were only sequenced with Illumina are omitted from these plots. Numerical values of statistics and additional sample information is provided in Table 2.

