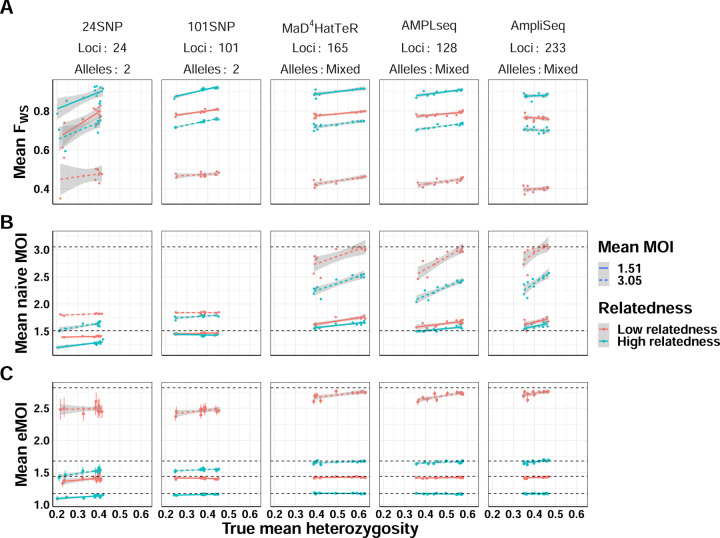
Figure 3. Comparison of mean eMOI to other summary measures of diversity across varying levels of within-host relatedness.
For each level of relatedness (low and high), we simulated 100 infections with a mean MOI of 1.51 and 3.16, for a total of 400 infections across 4 conditions. Keeping the MOI and relatedness fixed for each sample, we varied the genetic diversity of the panel used to genotype each sample. We then calculated the mean eMOI from MOIRE, mean MOI using the naive estimator, and mean FW S using a naive estimate of allele frequencies for each simulation to assess the sensitivity of each metric to varying the genetic diversity of the panel. True mean eMOI and mean MOI are fixed values within levels of within-host relatedness and are annotated by dashed lines. Mean FW S is not fixed within levels of within-host relatedness and MOI because it is a function of the genetic diversity of the panel.

