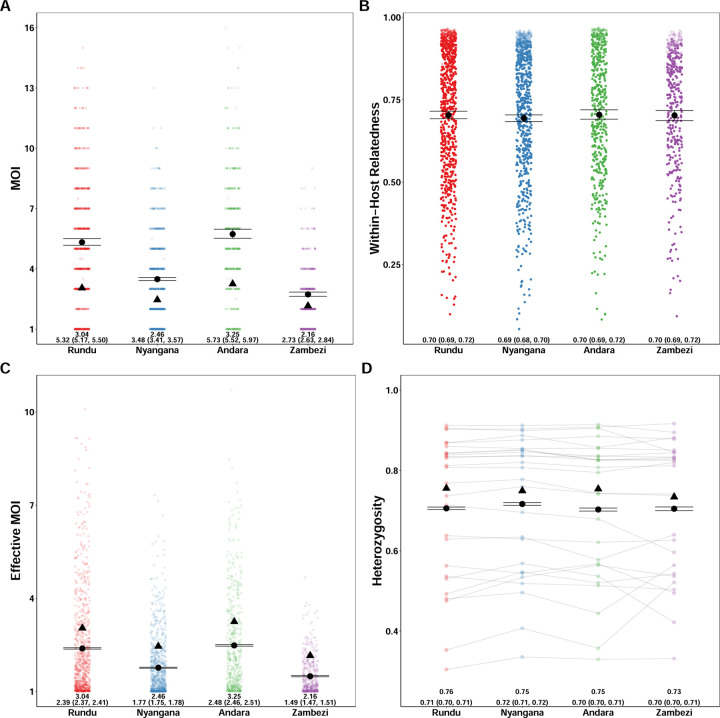
Figure 4. Estimated MOI, relatedness, eMOI and heterozygosity in Northern Namibia.
MOIRE was run on data from 2585 samples from 29 clinics genotyped at 26 microsatellite loci, subset across four health districts. Each point represents the posterior mean or median for each sample or locus level parameter. The black circle represents the population mean with 95% credible interval for each health district and the black triangle indicates the naive estimate where applicable. In the case of eMOI (C), the naive estimate is simply the MOI. Opacity was used to accommodate overplotting in A, C and D, however opacity in B is reflective of the posterior probability of a particular sample being polyclonal. This is due to the fact that mean within-host relatedness is only defined for samples with MOI greater than 1, and thus the posterior distribution of within-host relatedness was calculated by taking the mean within-host relatedness across samples with MOI greater than 1 at each iteration of the MCMC algorithm. Therefore, the opacity of each point in B is reflective of the contribution of that sample to the posterior distribution of mean within-host relatedness.

