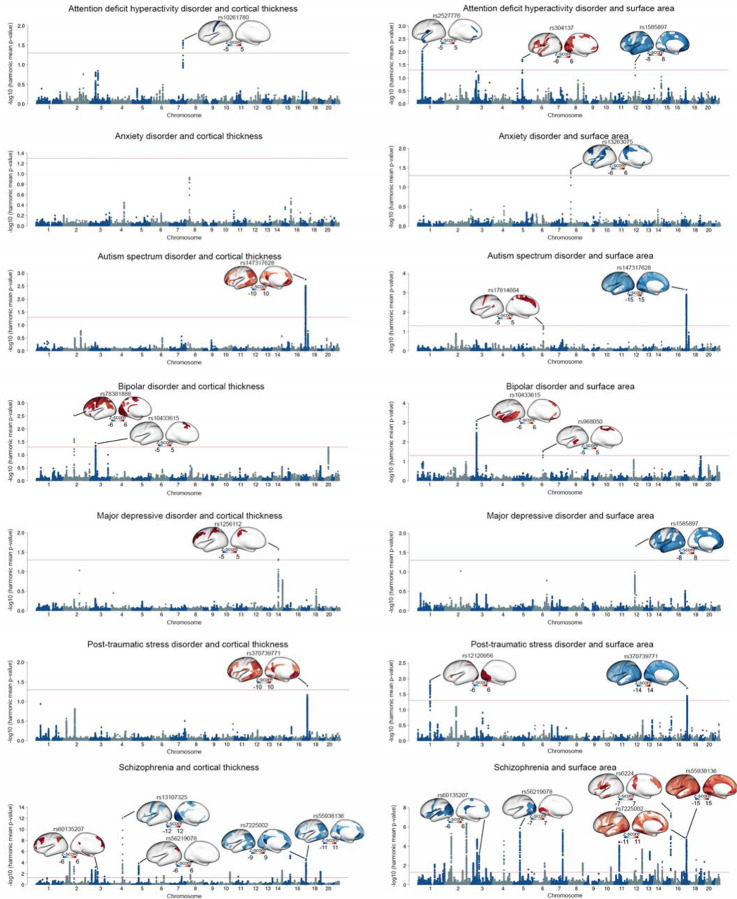
Figure 1. Shared genetic loci between psychiatric disorders and cortical thickness and surface area measures.
Manhattan plots illustrating the global conjunctional FDR analyses, highlighting the shared genetic loci between each psychiatric disorder and measures of cortical thickness and surface area. The significance threshold of harmonic mean FDR-corrected p-value<0.05 is represented by red lines. The cortical map illustrates the brain regions that are shared by the lead SNP with the specific psychiatric disorder. Red indicates concordant directions of effect, where greater psychiatric vulnerability is associated with thicker cortex or larger surface area. Conversely, blue represents discordant directions of effect, where greater psychiatric vulnerability is associated with thinner cortex or smaller surface area. Color bars indicate z-scores derived from the conjunctional FDR analysis between psychiatric disorders and brain structure.

