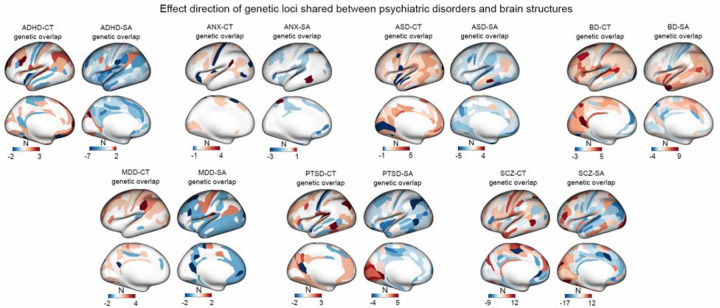
Figure 3. Effect direction of shared loci between psychiatric disorders and brain structure.
The cortical maps illustrate the disparity between the number of genetic loci exhibiting a concordant direction of effect and those displaying a discordant direction of effect between psychiatric disorders and brain structure. In the maps, red indicates brain regions where the number of genetic loci with a concordant direction of effect (i.e., the risk allele is associated with greater surface area or cortical thickness) exceeds those with an discordant direction of effect (i.e., the risk allele is associated with lower surface area or cortical thickness), while blue represents brain regions where the number of genetic loci with a discordant direction of effect is higher than those with a concordant direction of effect.

