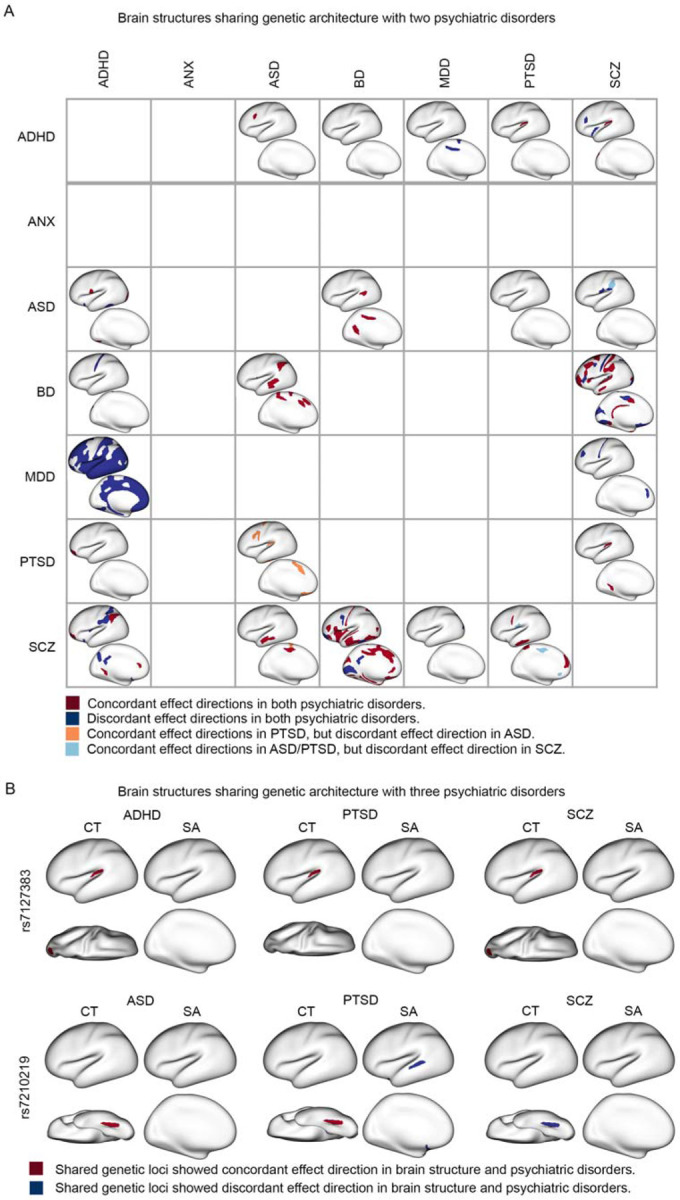
Figure 4. Overlapping genetic effect of psychiatric disorders on brain structures.

(A) The impact of shared genetic loci on brain structure for two psychiatric disorders is depicted. The lower left triangle illustrates the overlapping SA measures between the shared genetic loci for the two disorders. The upper right triangle illustrates the overlapping CT measures between the shared genetic loci for the two disorders. Dark red represents brain regions where the effect directions of shared genetic loci are consistent in both disorders. Dark blue represents brain regions where the effect directions of shared genetic loci are opposite in the two disorders. Orange and light blue represent brain regions where the effect directions of shared genetic loci are concordant in one disorder but concordant in the other disorder. (B) The overlapping brain patterns between shared genetic loci for three psychiatric disorders are shown. Red represents brain regions where the effect direction of genetic association is consistent in both the brain region and the respective psychiatric disorder. Blue represents brain regions where the effect direction of genetic association is negative in both the brain region and the psychiatric disorder.
