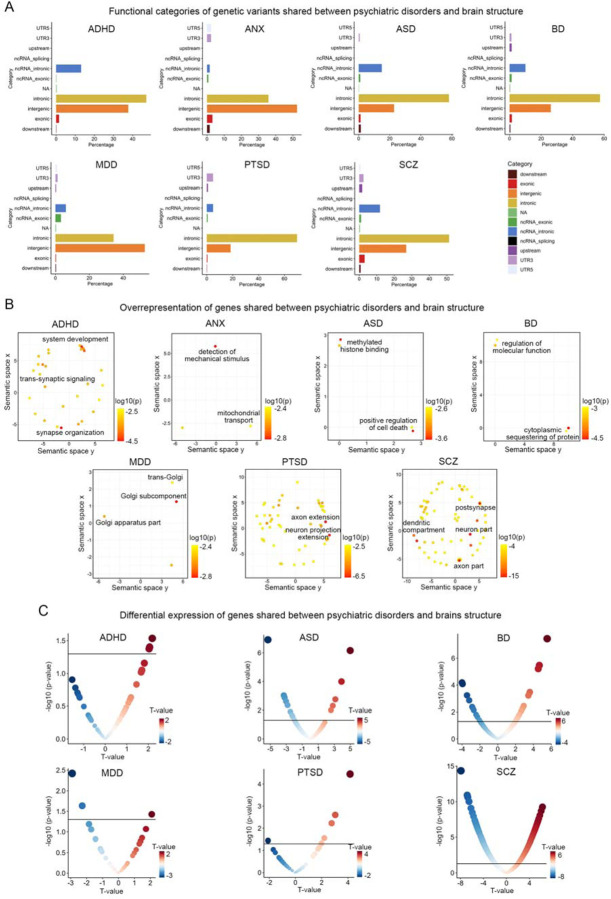
Figure 5. Functional annotation and differential expression of shared genes between psychiatric disorders and brain structures.
(A) Functional categories of lead genetic variants shared between psychiatric disorders and brain structures identified through conjunctional FDR analysis. The x-axis represents the proportion of shared genetic variants within each specific functional category, while the y-axis represents different functional categories. Each color corresponds to a particular functional category. (B) Overrepresentation analysis of genes located nearest to the shared genetic loci between psychiatric disorders and brain structures, presenting the results in a two-dimensional space using REVIGO. REVIGO reduces the dimensionality of gene-ontology terms based on pairwise semantic similarities. Red indicates biological terms with a lower p-value in the overrepresentation test. (C) Differentially expressed genes that overlap with genetic loci identified in the conjunctional FDR analysis of GWAS of psychiatric disorders and cortical brain structure. The horizontal black lines represent the significance threshold of p<0.05. Red dots indicate genes with up-regulated expression in individuals with the disorder compared to controls, while blue dots indicate genes with down-regulated expression. The size of the dots is scaled according to the absolute value of the t-values.

