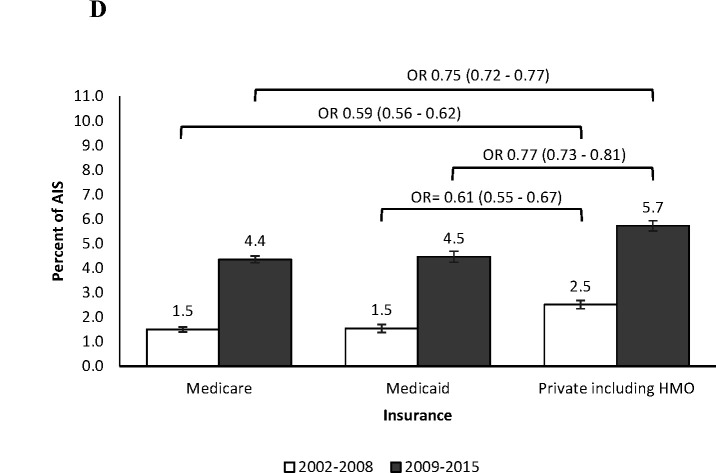
Figure 2D.
Dichotomized comparison of IVT use between Period 1 vs. Period 2 by insurance
*adjusted for female sex, age, race/ethnicity, national quartile of household income by zip code, insurance, hospital region, hospital location/teaching status, hypertension, diabetes, dyslipidemia, obesity, coronary artery disease, peripheral artery disease, atrial fibrillation, congestive heart failure, Charlson Comorbidity Index, smoking history, and alcohol history.

