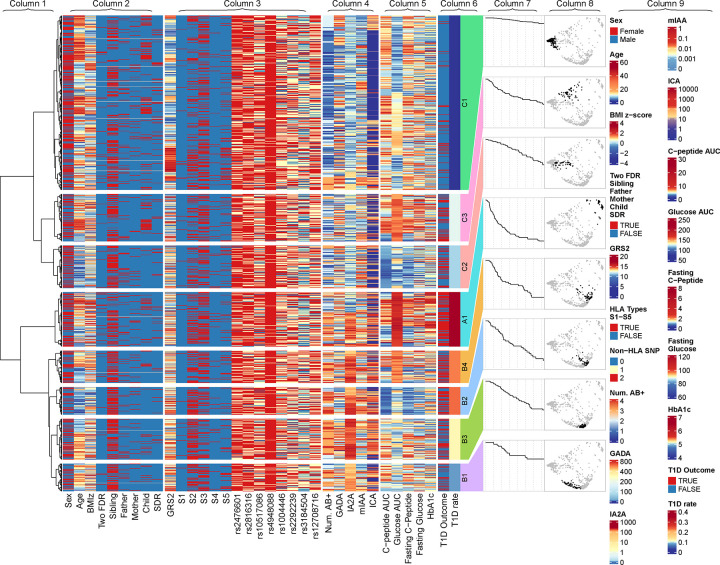
Figure 1.
Dendrogram and heatmap resulted from the clustering analysis. From left to right, the displayed information is the complete-linkage dendrogram (Column 1), the heatmap of demographic information (Column 2), the heatmap of genetic information (Column 3), the heatmap of immunological markers (Column 4), the heatmap of metabolic markers (Column 5), the heatmap of T1D outcomes and rates (Column 6), diabetes-free Kaplan-Meier survival curves of clusters (Column 7), distribution of clusters on the multidimensional scaling map (Column 8), and, in the foremost right side, the legends denoting the color scheme for the variables (Column 9).

