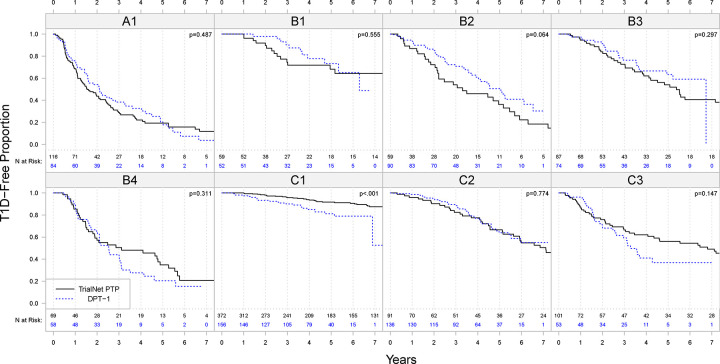
Figure 4.
Comparison of diabetes-free Kaplan-Meier survival curves of clusters in the analysis dataset (TrialNet PTP; black solid lines) and the validation dataset (DPT-1; blue dashed lines). The numbers under the curves are the numbers of subjects at risk in the cluster at each time point P-values on the upper right corners are based on log-rank tests.

