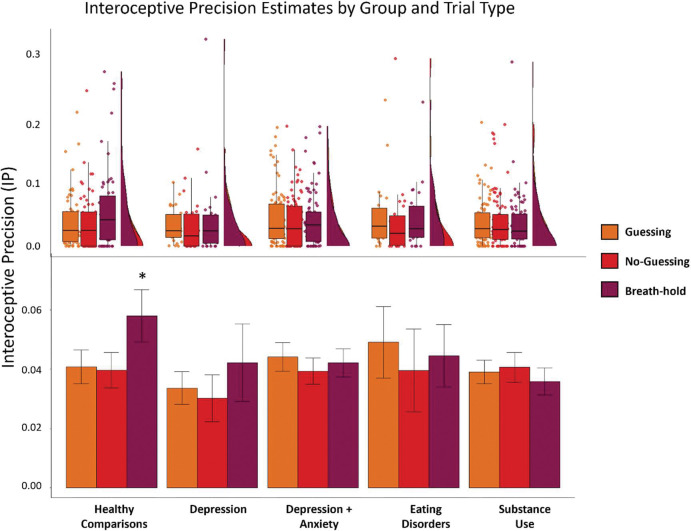
Figure 5.
Bottom: Mean and standard error for interoceptive precision estimates by condition and clinical group. The black asterisk indicates that interoceptive precision () was significantly greater in healthy comparisons than other groups (transdiagnostically) in the breath-hold condition, and healthy comparisons showed a significant increase in from the guessing and no guessing condition to the breath-hold condition that was absent in the other groups. Top: For more complete data characterization, we also show raincloud plots depicting the same results in terms of individual datapoints, boxplots (median and upper/lower quartiles), and probability densities.

