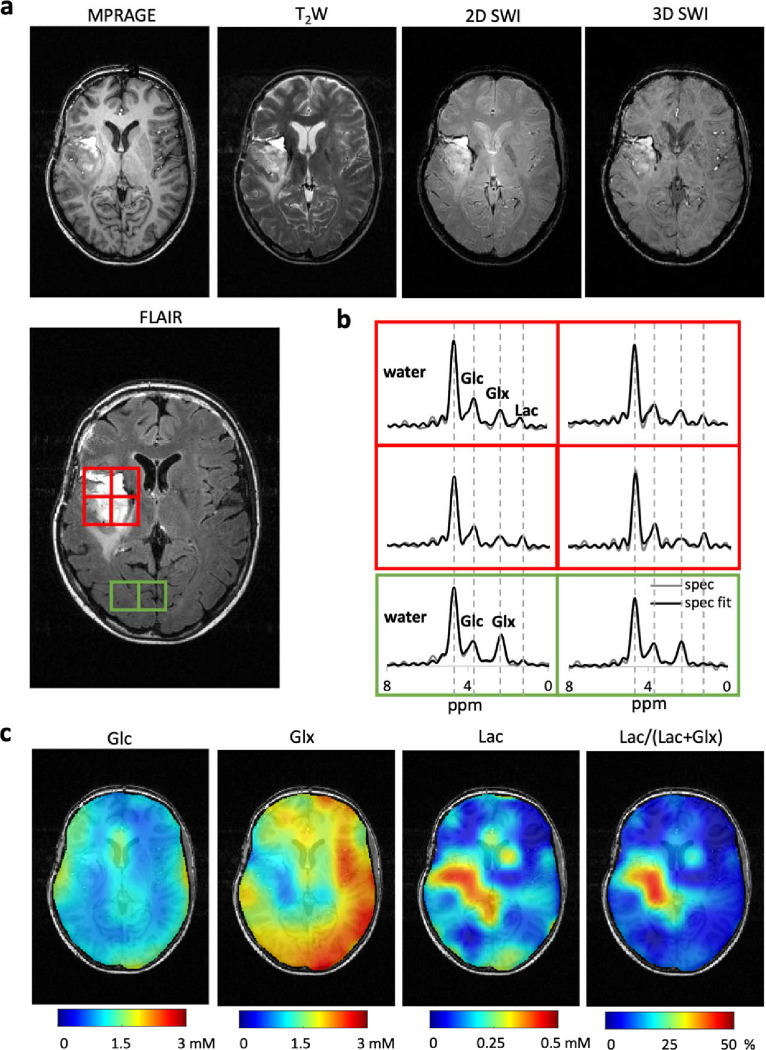
Figure 3. Parallel MRI and DMI on a brain tumor patient.
(a). MRIs acquired using the MRI-DMI protocol demonstrates the tumor area in the brain. Representative leisional and healthy brain tissue regions are highlighted on the FLAIR MRI in red and green boxes respectively, with their DMI spectra displayed in (b). (c) Metabolic maps representing the concentration of Glucose (Glc), Glutamate +Glutamine (Glx) and lactate (Lac) obtained using spectral fitting. The Lac/(Lac+Glx) ratio is used to illustrate the extend of the difference in glucose metabolism, differentiating tumor from healthy brain tissues.

