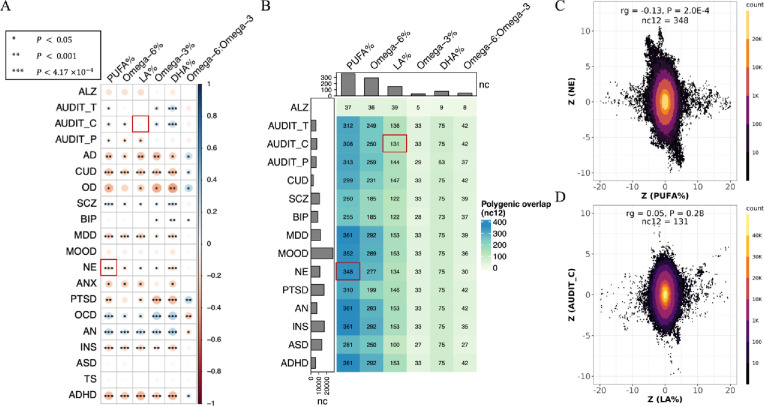
Figure 1: Widespread, moderate genetic basis shared between cPUFAs and brain disorders.
A) Pairwise genetic correlations between six cPUFAs and 20 brain disorders. P-value cutoffs of 0.05, 0.001, 4.17×10⁻⁴ are used to represent increasing levels of statistical significance; colors are used to represent degree of genetic correlation (rg) between two traits. B) Pairwise polygenic overlaps between six cPUFAs and 15 brain disorders. The color and number of each box indicate the degree of polygenic overlap and number of causally associated SNPs shared between cPUFAs and brain disorders (nc12). Bar plots on the top and left indicate the number of cPUFAs- and brain disorders- associated variants, respectively, which explain 90% of SNP-based heritability. Two cPUFA-brain disorder pairs highlighted in the red boxes correspond to panels C) and D). C) Genetic effects of genome-wide SNPs on PUFA% (x axis) and NE (y axis). D) Genetic effects of genome-wide SNPs on LA% (x axis) and AUDIT_C (y axis). Each dot represents a genetic variant; colors indicate variant density.

