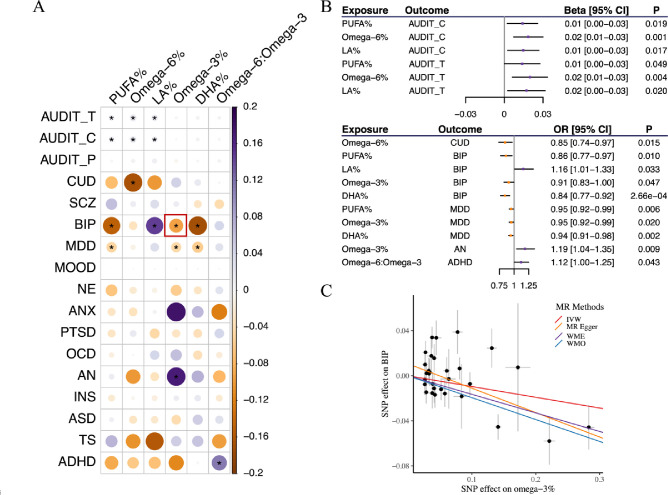
Figure 2. Statistical inference of causal relationship between cPUFAs and brain disorders.
A) A heatmap summarizing the effects of six cPUFAs on 17 brain disorders. IVW p-value of 0.05 is used to represent statistical significance. Colors represent the effects (βIVW) of cPUFAs on brain disorders. The pair of omega-3% and BIP highlighted in the red box corresponds to panel C). B) MR results showing a significant association between cPUFAs and brain disorders. Beta and OR estimated using IVW method are used to represent the effects of cPUFAs on continuous and binary outcomes, respectively. C) MR estimated effects of omega-3% (x axis) on BIP (y axis). Effects estimated by the four models are shown by fitted lines; slopes of these lines indicate the effect sizes.

