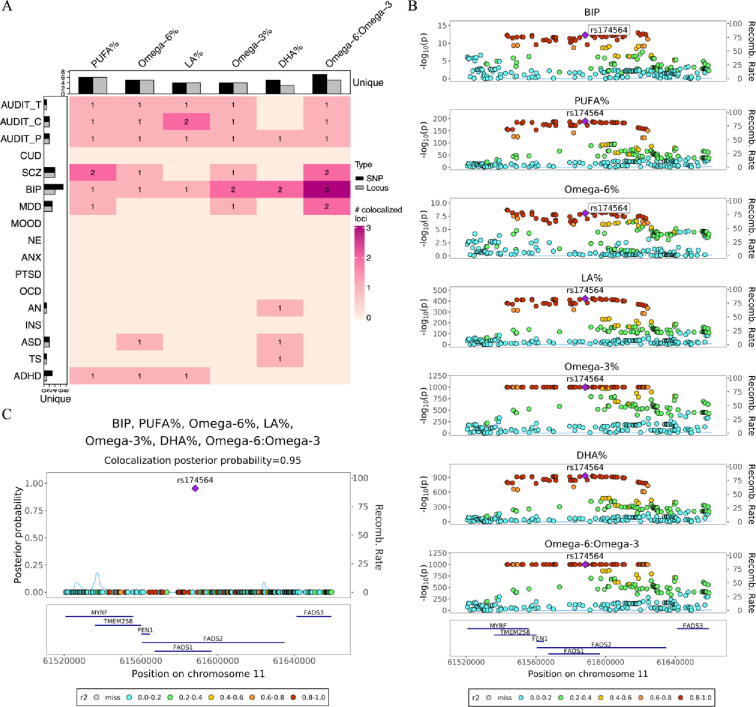
Figure 3. Colocalization analysis detects genomic loci shared between cPUFAs and brain disorders.
A) A heatmap summarizing pairwise colocalization between six cPUFAs and 17 brain disorders. The color and number of each box indicate the number of significant colocalized regions between cPUFAs and brain disorders (PP > 0.7). Bar plots on the top and left indicate the numbers of unique colocalized SNPs (black) and loci (grey, PP > 0.7) for cPUFAs and brain disorders, respectively. B) Regional association plots of six cPUFA phenotypes and BIP in chr11:61,520,000–61,660,000. Variant positions are shown on x axis, −log10P on the left y axis, recombination rate on the right y axis; variant rs174564 is marked as the lead SNP; genes located in the region are shown in the bottom. LD r2 values are indicated by colors, and recombination rates by curves. C) Multi-trait colocalization analysis combing six cPUFA phenotypes and BIP identified a putative shared causal variant rs174564 (PP = 0.95). PP values are shown on y axis.

