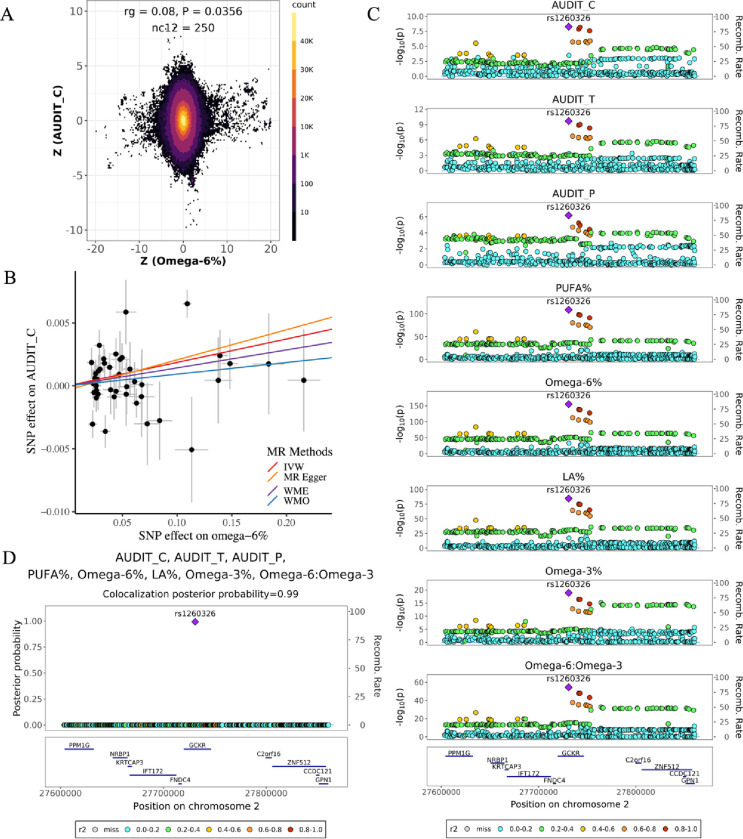
Figure 4. Evidence supporting the effect of omega-6% on alcohol consumption.
A) Genetic effects of genome-wide SNPs on omega-6% (x axis) and AUDIT_C (y axis). Each dot represents a genetic variant; colors indicate the variant density. B) MR estimated effects of omega-6% (x axis) on AUDIT_C (y axis). Effects estimated by the four models are shown by fitted lines; slopes of these lines indicate the effect sizes. C) Regional association plots of five cPUFA phenotypes and three alcohol consumption phenotypes in chr2:276,000,000–27,900,000. Variant positions are shown on x axis, −log10P on the left y axis, recombination rate on the right y axis; variant rs1260326 is marked as the lead SNP; genes located in the region are shown in the bottom. LD r2 values are indicated by colors, and recombination rates by curves. D) Multi-trait colocalization analysis combing five cPUFA phenotypes and three alcohol consumption phenotypes identified a shared putative causal variant rs1260326 (PP = 0.99). PP values are shown on y axis.

